
On Friday, the AUD/USD currency pair pulled back from session highs near 0.7138 to trade around 0.7110. The currency pair trades within a descending channel formation on the 60-minute chart.
The pair continues to trade slightly below the 100-hour moving average line after the latest pullback. Friday’s pullback prevented the currency pair from ascending into the overbought levels of the 14-hour RSI.
AUD/USD Fundamentals Overview

From a fundamental perspective, the AUD/USD currency pair trades during a relatively busy period in the US market. On Friday, the US industrial production for August missed the expected (MoM) change of 0.3%, with a change of 0%. On Thursday, building permits for August also missed the forecast of 1.41 million, with 1.394 million, down from the previous month’s equivalent of 1.433 million. On the other hand, housing starts for the period fell to 1.275 million, down from 1.309 million, missing the forecast of 1.31 million.
Elsewhere, the initial jobless claims for last week came in better than expected, at 196k versus a forecast of 208k, down from the preceding week’s equivalent of 206k. The Philadelphia Fed Manufacturing Survey for September also exceeded the forecast of 30.5, with a reading of 37.8, down from the previous month’s equivalent of 47.4. On the other hand, pending home sales for August missed the expected (MoM) change of 2%, with a change of 0.3%.
Earlier in the week, the US retail sales for August outperformed the expected (MoM) change of 0.8%, with a change of 1.2%. The retail sales ex-autos also beat the forecast of 0.5%, with a change of 1.4%. The Federal Reserve hiked the base interest rate by 25 basis points to 4%, up from 3.75% as expected.
AUD/USD Technical Analysis (the 60-min Chart)
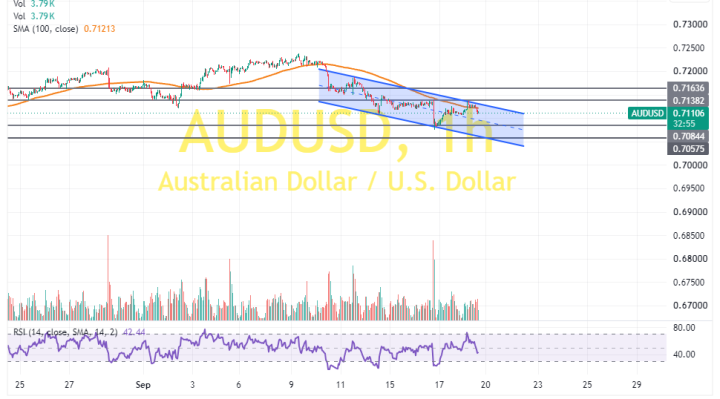
Technically, the AUD/USD currency pair trades within a descending channel formation in the 60-minute chart. The 14-hour RSI has also pulled back to avoid rallying into overbought conditions.
Therefore, the bears will look to stretch the current pullback towards 0.7084 or lower, to 0.7057. On the other hand, the bulls will look to pounce on rebounds at about 0.7138 or higher, at 0.7163.
AUD/USD Technical Analysis (the Daily Chart)
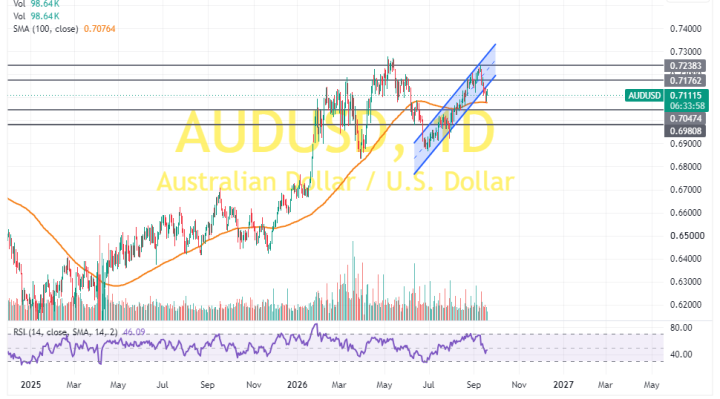
In the daily chart, the AUD/USD currency pair has recently completed a downward breakout from an ascending channel formation. However, the 14-day RSI still has room left to run before reaching oversold conditions.
Therefore, the bears will look to extend the current pullback towards 0.7047 or lower, to 0.6980. On the other hand, the bulls will look to pounce on rebounds at about 0.7176 or higher, at 0.7238.