
Bitcoin ($BTC) has broken above a descending triangle pattern on the BTC/USDT chart. It has cleared the triangle with a notable increase in trading volume. This move signals improvement in short-term bullish momentum. However, the cryptocurrency remains below its 100-day moving average (100MA). 100MA is acting as a resistance level for buyers.
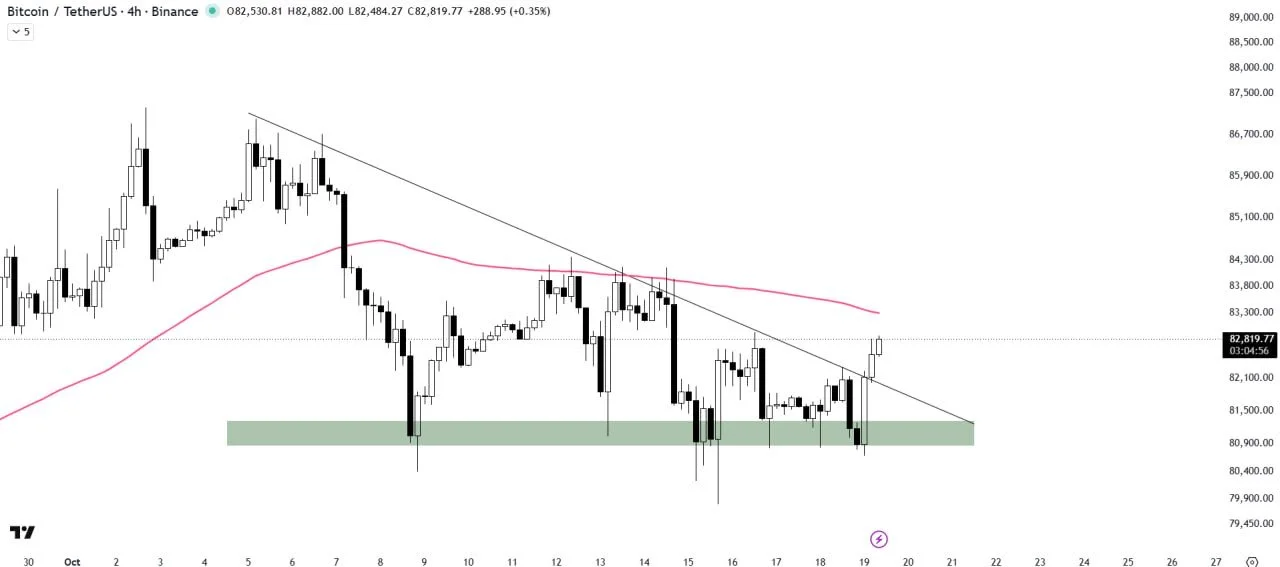

Technical analysis suggests that Bitcoin’s breakout may give further gains if buyers maintain control. For this, the price needs to hold above the pattern’s breakout zone. A retest of the broken resistance level also remains possible. Coming few trading sessions will clarify if it is a sustained breakout or a fake out.
Bitcoin Tests Key Resistance After Triangle Breakout
Bitcoin is trading in the $82,500–$82,800 range after briefly crossing $83,000. The rebound followed a brief drop into $79,000’s when hotter-than-expected US inflation data initiated panic selling.
The descending triangle formed as price faced a downward-sloping resistance line. It repeatedly tested the horizontal support area. Today’s breakout above the upper trendline suggests that buyers have gained enough momentum. Nevertheless, the breakout alone does not confirm a sustained trend reversal. Bitcoin must maintain its position above the breakout area.
100-Day Moving Average Remains a Major Hurdle
The 100-day moving average is the next important technical level for $BTC. Bitcoin remains below this indicator as it poses the next immediate resistance line. A successful break above that area is needed to clear the way towards $87,000.
Bitcoin’s ability to hold its recent gains while challenging the 100-day moving average is needed to determine if the latest breakout is strong enough. Conversely, renewed selling pressure or a failure to defend the breakout may bring the recent support range back into focus.
For now, the volume-backed move above the descending triangle pattern offers a constructive short-term signal. However, the confirmation will depend on sustained price action.