
On Friday, the gold price extended the mid-week rebound from Wednesday’s low of $4,073 to trade at about $4,173. XAU/USD trades within an ascending channel formation on the 60-minute chart.
The price of the yellow metal has now advanced to trade slightly above the 100-hour moving average line. However, gold pulled back to avoid rallying into the overbought levels of the 14-hour RSI.
Gold Price Fundamentals Overview

From a fundamental perspective, XAU/USD trades during a relatively busy period in the US market. On Thursday, the producer price index for September rose sharply from 0.5% last month to 1.3%, ahead of the forecast (MoM) change of 0.5%. The (YoY) equivalent also edged higher to 6.3%, up from 5.6% in August, beating the forecast change of 5.3%.
The producer price index ex-food and energy for the period exceeded the forecast (MoM) and (YoY) changes of 0.3% and 4.4%, respectively, with changes of 0.7% and 5%.
On the other hand, US retail sales for September grew by 0.8%, beating the (MoM) forecast of 0.3%. The retail sales ex-autos for the period also beat the expected (MoM) change of 0.5%, with a change of 0.9%.
Earlier in the week, the consumer price index for September matched the forecast (MoM) change of 0.6%, up from 0.4% in August. The (YoY) equivalent rose higher than expected, to 3.7% versus a forecast of 3.6%, up from 3.4%. On the other hand, the consumer price index ex-food and energy for the month surpassed both the (MoM) and (YoY) forecasts of 0.2% and 2.5%, respectively, with changes of 0.3% and 2.6%.
Gold Price Technical Analysis (the 60-min Chart)
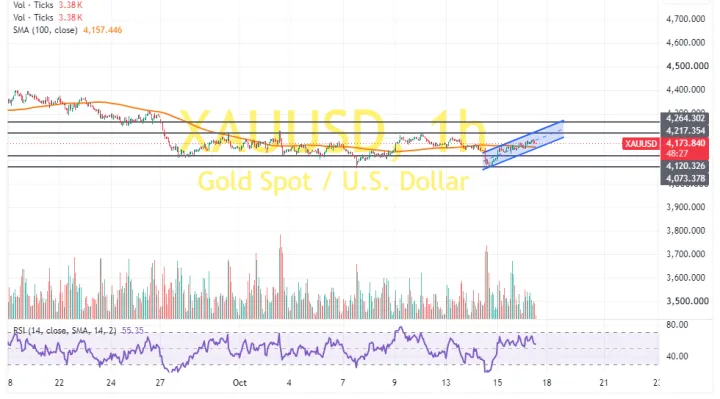
Technically, the gold price trades within an ascending channel formation on the 60-minute chart. However, the 14-hour RSI has recently pulled back to avoid advancing into overbought conditions.
Therefore, the bears will look to extend the latest pullback towards $4,120 or lower, down to $4,073. On the other hand, the bulls will look to ride the current rally towards $4,217 or higher, up to $4,264.
Gold Price Technical Analysis (the Daily Chart)
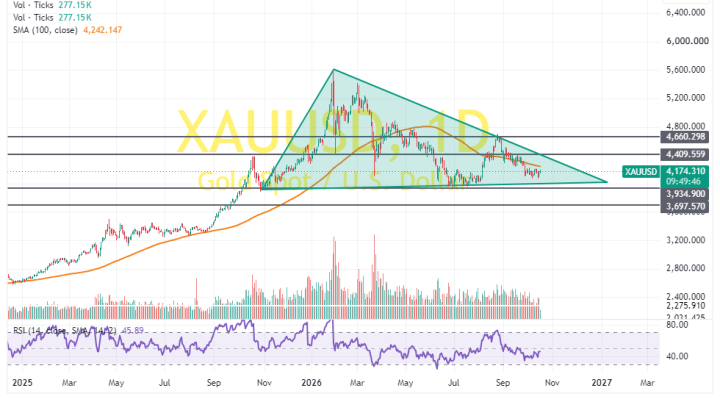
In the daily chart, the price of the yellow metal trades within a consolidative triangle formation. However, the 14-day RSI still has room left to run before reaching oversold conditions.
Therefore, the bears will look to stretch the current declines toward $3,934 or lower, down to $3,697. On the other hand, the bulls will look to pounce on rebounds at about $4,409 or higher, up to $4,660.