
On Thursday, the AUD/USD currency pair pulled back from the session highs of about 0.6961 to trade at about 0.6920. The currency pair also completed a downward breakout from a sideways channel formation on the 60-minute chart.
The pair continues to trade a few levels below the 100-hour moving average line, despite attempting a late rebound. The late rebound helped the currency pair recover from the oversold levels of the 14-hour RSI.
AUD/USD Fundamentals Overview

From a fundamental perspective, the AUD/USD currency pair trades during a relatively busy period in both markets. In Australia, the seasonally adjusted employment change for September missed the expectation of 20k, with a change of -39.3k, down from the previous month’s equivalent of 29.3k. The participation rate also fell to 66.7% from 67% in August, missing the forecast of 67%. However, the unemployment rate was unchanged at 4.7% but still above the forecast of 4.6%.
In the US, the initial jobless claims for last week edged slightly higher to 199k, up from the preceding week’s upward-revised figure of 198k, but still below the forecast of 200k. The NY Empire State Manufacturing Index for October also came in better than expected, at 25.5 versus a forecast of 10.3, up from the previous month’s 7.6. On the other hand, the Philadelphia Fed Manufacturing Survey for October fell to 20.9, down from 37.8 in September, missing the forecast of 28.4.
Elsewhere, the producer price index for September spiked to 1.3% (MoM), up from 0.5% in August, beating the forecast of 0.5%. The (YoY) equivalent also came in higher than expected, at 6.3% versus a forecast of 5.3%, up from the previous month’s 5.6%.
AUD/USD Technical Analysis (the 60-min Chart)
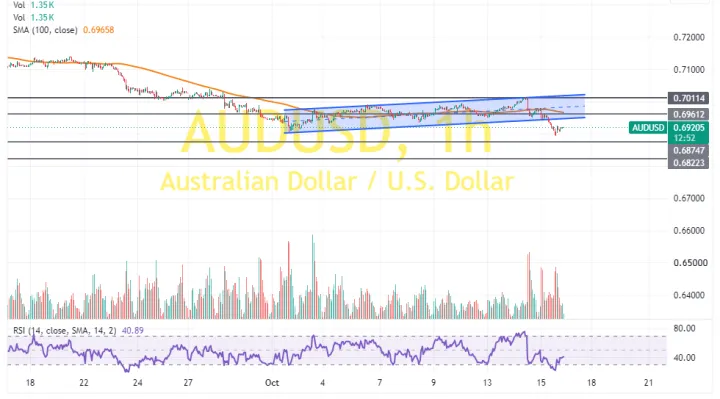
Technically, the AUD/USD currency pair has recently completed a downward breakout from a sideways channel formation on the 60-minute chart. However, the 14-hour RSI bounced back to recover from oversold conditions.
Therefore, the bulls will look to stretch the current rebound towards 0.6961 or higher, up to 0.7011. On the other hand, the bears will look to pounce on pullbacks at about 0.6874 or lower, down to 0.6822.
AUD/USD Technical Analysis (the Daily Chart)
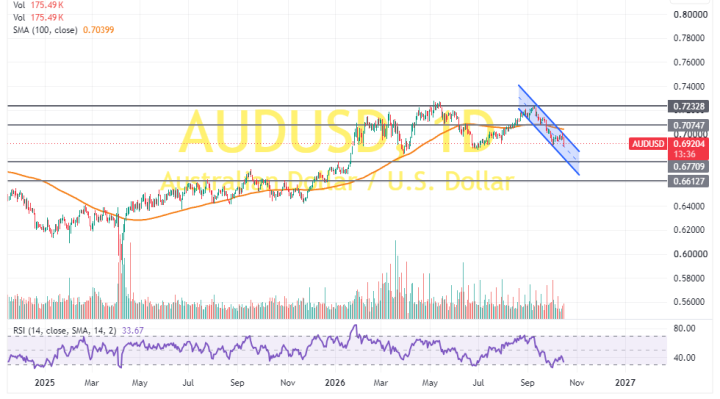
In the daily chart, the AUD/USD currency pair trades within a descending channel formation. However, the 14-day RSI has recently bounced back to avoid falling into oversold conditions.
Therefore, the bulls will look to extend the current rebound towards 0.7074 or higher, up to 0.7232. On the other hand, the bears will look to stretch the current declines toward 0.6771 or lower, down to 0.6612.