
Silver long-term technical analysis
Silver upward movement in October stumbled as U.S dollar index bull awakens from slumber. The bullish move of U.S dollar in the last quarter of 2017 is widely expected by analysts and could push its counterpart down. Silver is not an exception; fortunately, the price jumped at the start of November after the Fed announced interest-rate. Silver bull pushed the price up from $16.65 to $17.08 and indicated further upside in November.

Despite the bullish push, we think the upward movement of silver might stall between $17.00 – $17.40 and resume its bearish move. The reason mostly on the U.S dollar index outlook which turns bullish. However, a major turn in the index will change our outlook if it happens.
Click here to see previous Silver long-term technical analysis October 2017
Monthly chart
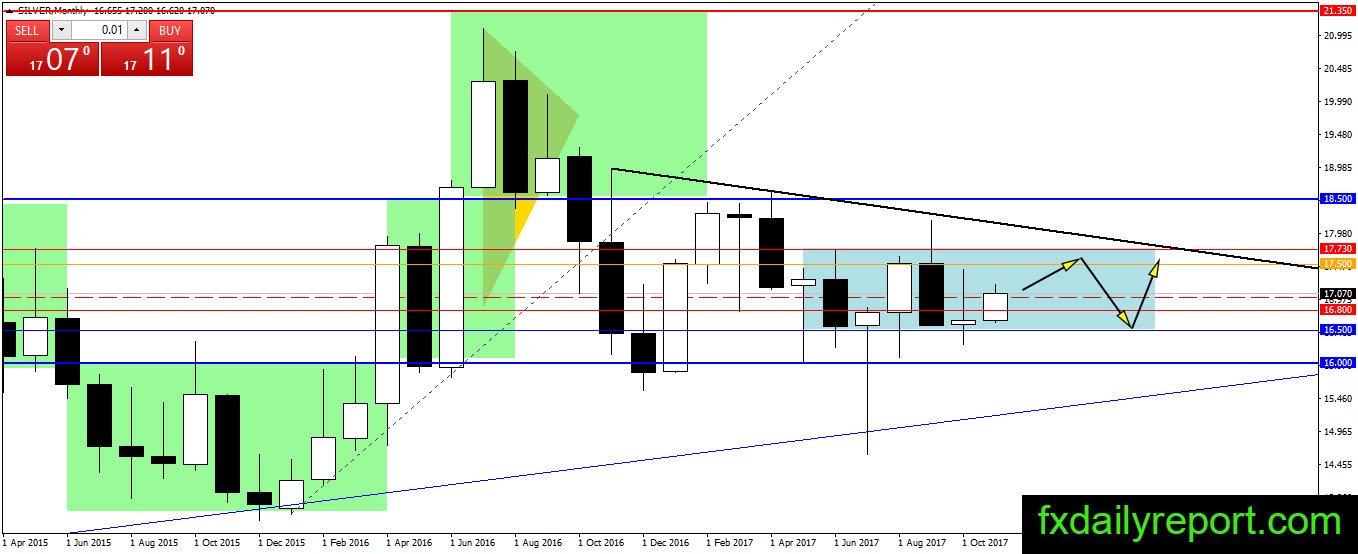
Silver on the monthly chart shows a continuation sideway movement inside the blue range between $16.50 – $17.73. The price upward movement sold by the bear in the previous month and closed near its opening level. This month, the bull started the month with another bullish push targeting $17.73. Will the market continue upward or will it drift lower to break $16.50?
Weekly chart
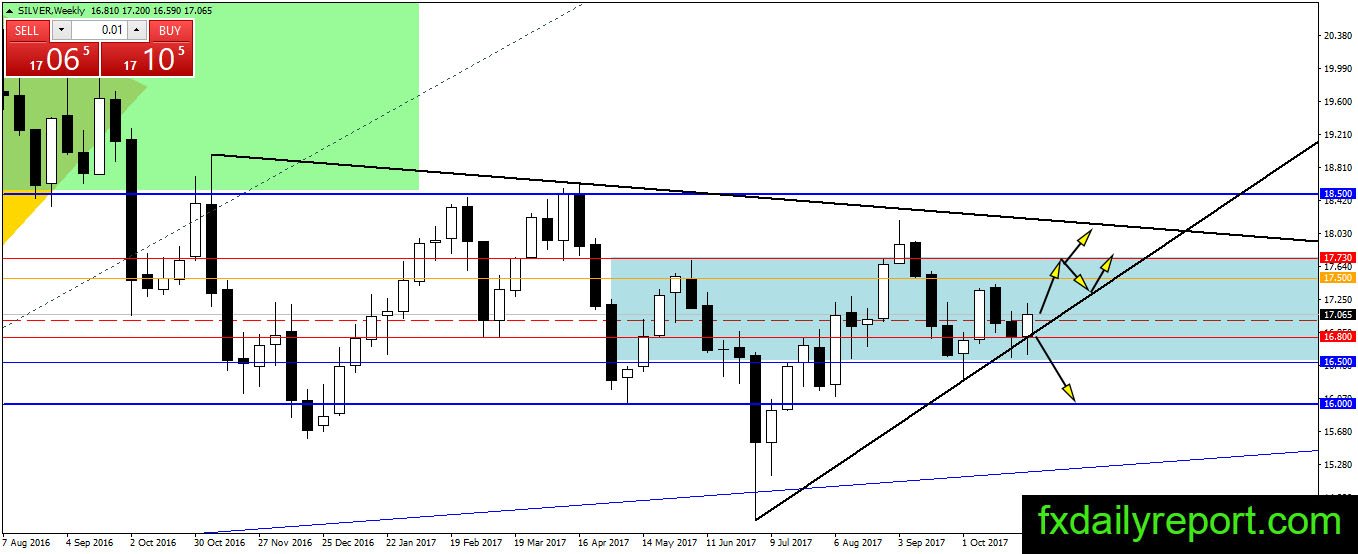
Silver is on the progress of bounce from the trendline on the weekly chart. The price also never closed below $16.80 on the support test. If the bull could close the week above $17.00, it will confirm the bounce toward $17.73.
Daily chart
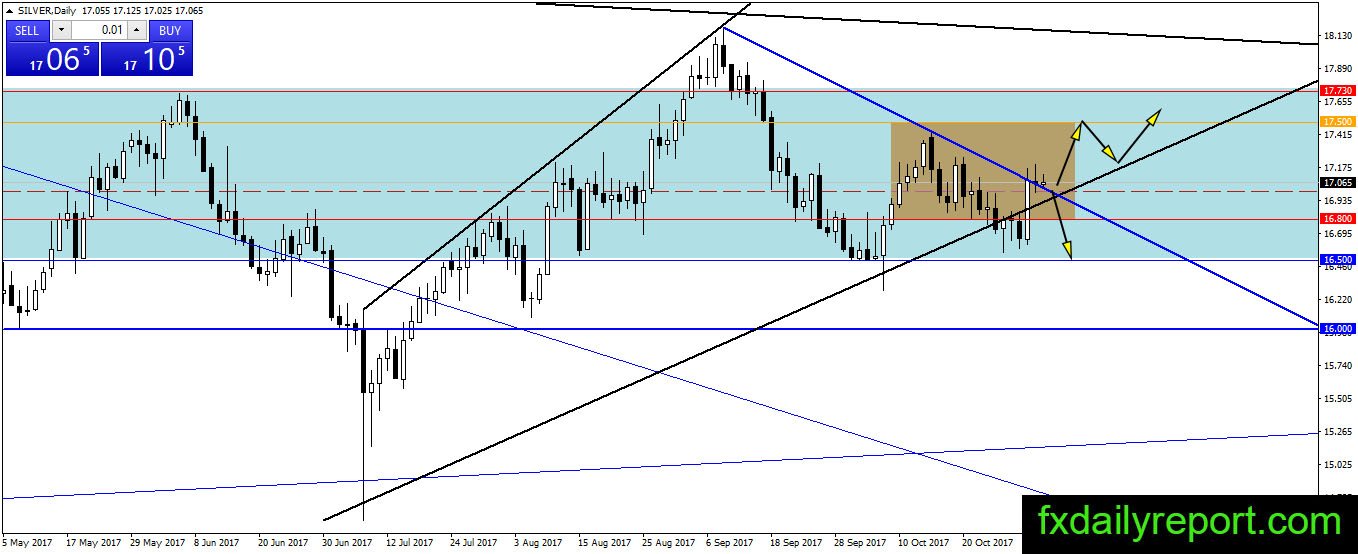
Silver upward movement paused at the blue trendline shown on the daily chart. There have been two consecutive closes at the trendline, and the price has not moved far from the resistance. If silver closed lower below $17.00 and back below the blue trendline, it would open bearish scenario toward $16.50.
Trade plan
Bullish: No setup yet, but the bull needs a close above $17.00 on the weekly chart. If weekly close above $17.00, traders could use $17.00 as support level to enter a long position.
Bearish: There is potential for the short position from the blue trendline shown on the daily chart, but no strong setup formed yet. The best short position could be taken near $17.73.