
Silver long-term technical analysis
Silver mostly unmove and traded between $16.00 – $17.50 in several months. The precious metal might not make major moves and slowly lose volatility as summer holiday season kick-in. However, traders might want to watch The Fed interest-rate decision and future outlook to determine if U.S dollar will resume the uptrend.
On the other hand, there is trade wars issue and U.S-North Korea summit planned. Both issues might trigger major movement in the financial market.

Click here to see previous Silver long-term technical analysis March 2018
Monthly chart
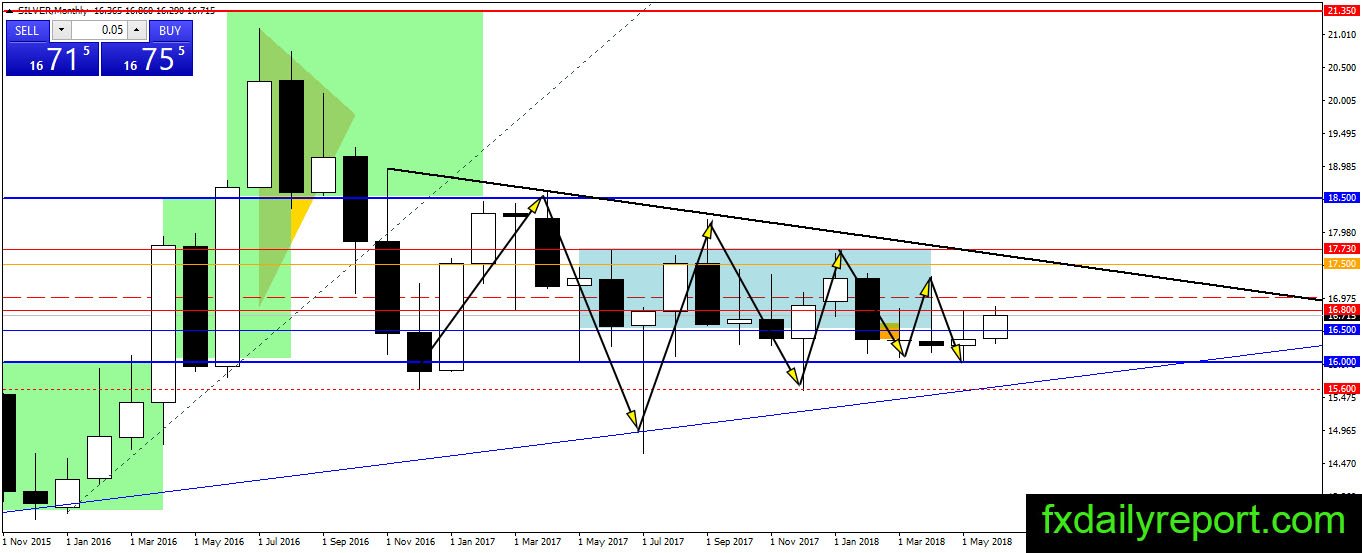
Silver price squeeze continues and the range gets tighter and tighter. Base on the past studies, the tighter the range, the more explosive is the momentum movement. Not much to expect yet at the current time, traders could continue trade the range while waiting for a breakout.
Weekly chart
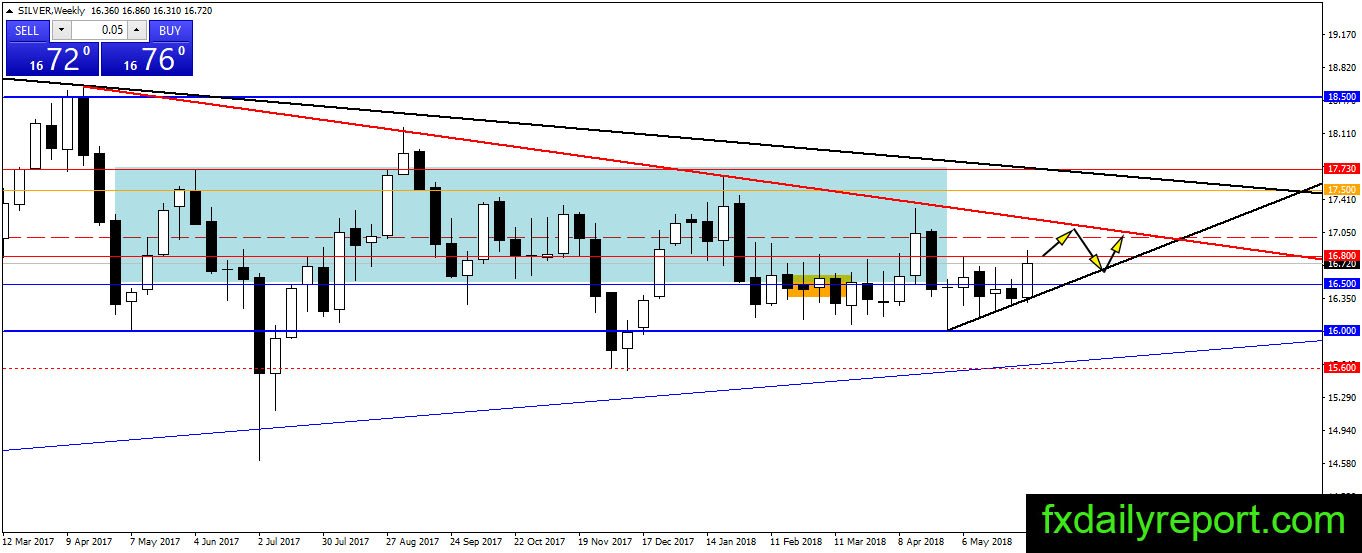
The weekly chart shows a bounce from the bottom range. We mark the level with black trendline and project silver will reach the red trendline. The level coincides with $17.00 resistance level and suggests traders look for short position when silver hit $17.00.
Daily chart

The bull is attacking the $16.50 resistance on the daily chart. Judging from the weekly chart, there is momentum in current upmove, and we expect silver could reach $17.00 in several days. If the price move down, $16.50 is the level to look for a long position.
Trade plan
Bullish: Long-term traders could wait for silver to reach $16.00 before placing position. The range between $16.00 – $17.50 has been held for almost a year, and it might continue holdout this year. (Same strategy). Short-term, traders could watch $16.50 for possible long.
Bearish: Short position could be placed near $17.00 resistance or the red trendline on the daily chart.