
Silver long-term technical analysis
The bearish close in November’17 followed through by the bear with a push below $16.00. However, the bear losing momentum and December closed as a bullish candlestick. After the close, we see the price bouncing between $16.00 – $16.50. The sideways movement expected to continue this year too as the market heading to a possible trade war.
This year, the key event comes from the U.S The Fed. Last year, the Fed outline three interest-rate hikes for 2018. However, as Jerome Powell turn into the office, the speculation turned to four rate-hike following the hawkish testimony in front of Senate and Congress.

We will see the first interest-rate decision soon in days count. Will the new Fed chief make the four rate-hike become a reality?
Click here to see previous Silver long-term technical analysis December 2017
Monthly chart
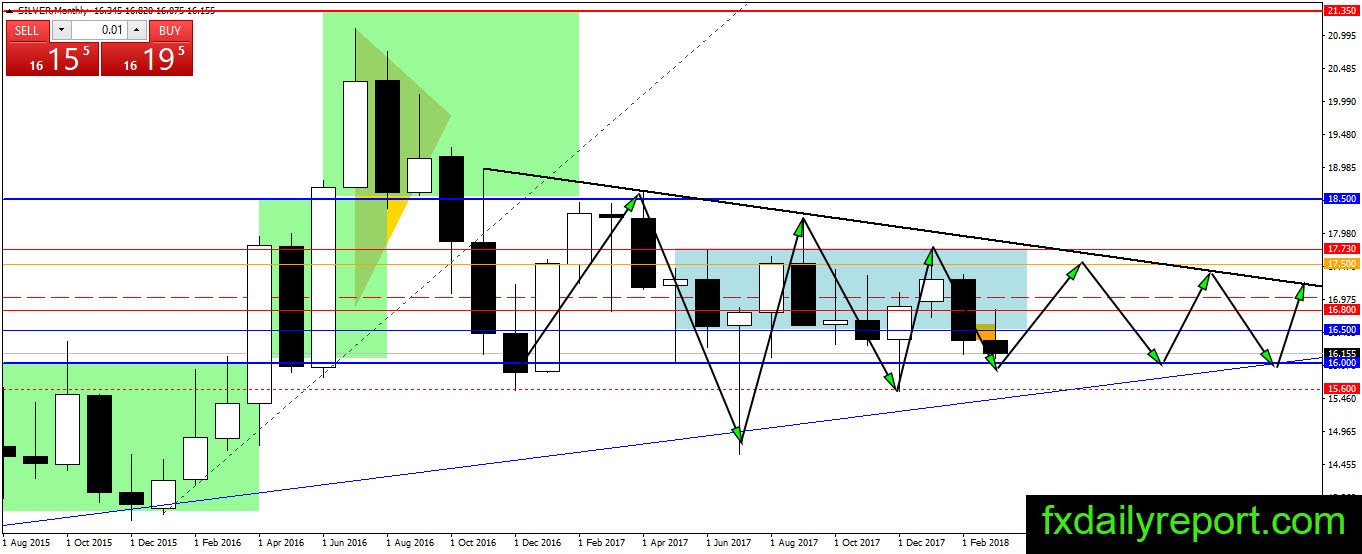
Not much to expect on the monthly silver chart as the price continue traded between $16.00 – $17.50 since May previous year. There are three instances of movement outside the range, but no close outside the range yet. Traders could continue to use $16.00 – $17.00 as a reference level to take a position. As long as there is no change to the fundamental situation, silver will continue its sideways movement.
Weekly chart
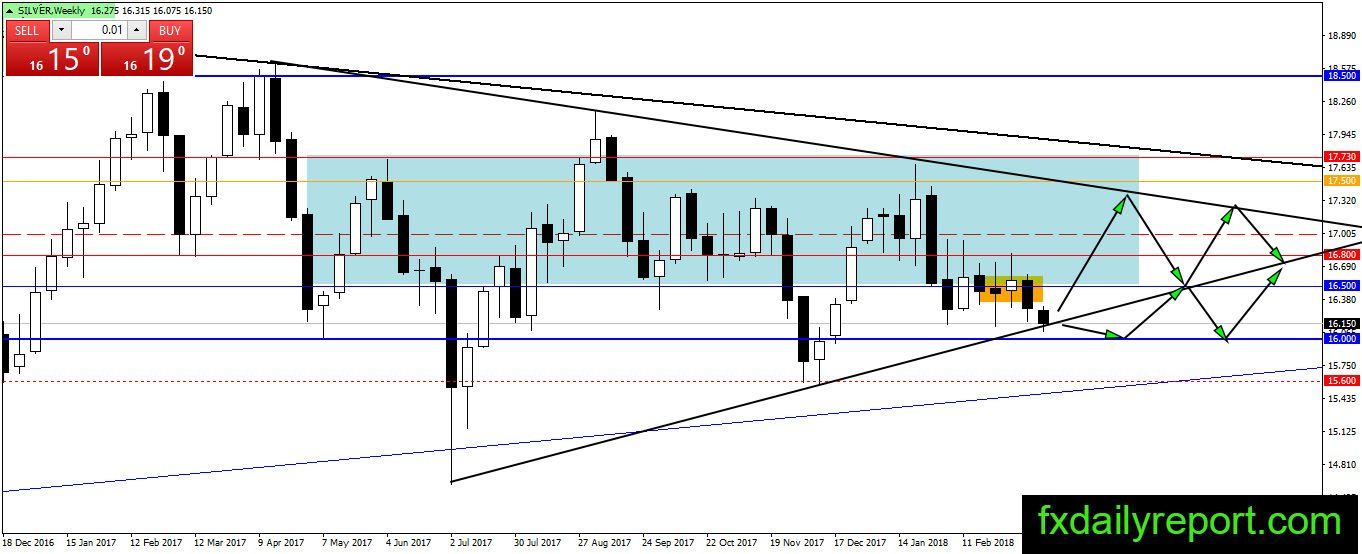
Silver prices are not far from $16.00 support level and are currently testing the support trendline. Will we see a bounce from the current level and start of an upward movement toward $17.50?
Daily chart
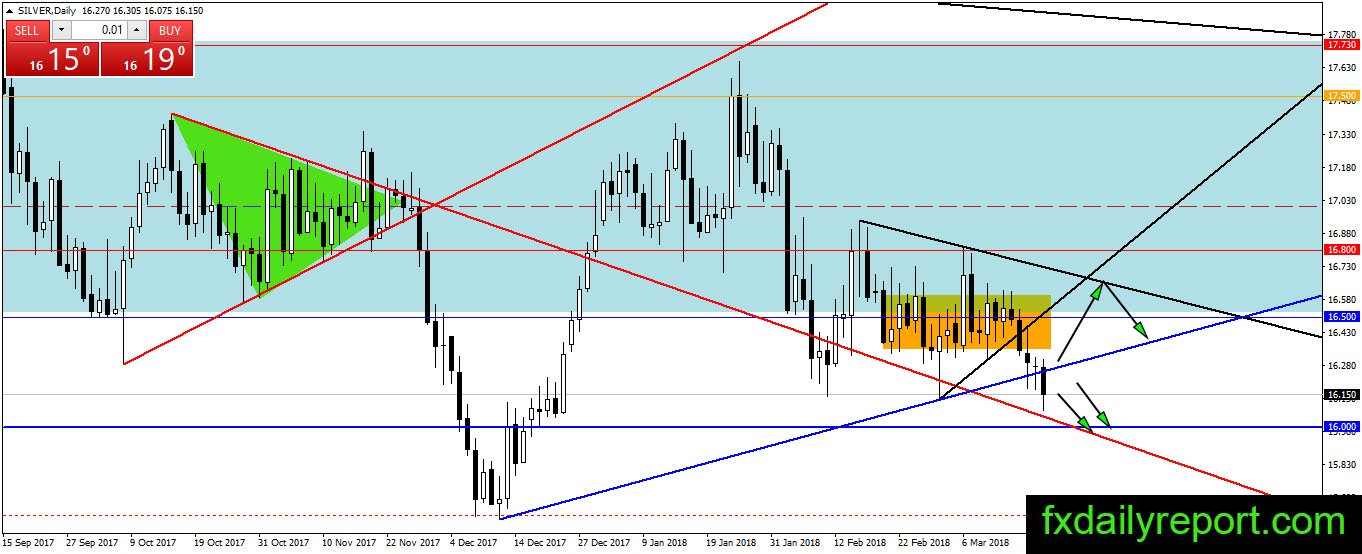
The daily chart of silver looks more bearish than two other charts. The silver break below the support trendline and ready to reach $16.00 support level. The price has not closed yet, but there is enough downward momentum. As long as the price does not return above the trendline, it is safe for the bear.
Trade plan
Bullish: Long-term traders could wait for silver to reach $16.00 before placing position. The range between $16.00 – $17.50 has been held for almost a year, and it might continue holdout this year.
Bearish: Short position at the current level is not suggested as it is selling toward the support level. Traders might want to look for a short position at higher place especially the $17.50 resistance.