
AAPL Long-term outlook
AAPL has been traded between $170.00 – $180.00 since the beginning of the year. Moreover, it is the first time the share prices close below $170.00 in April. Fortunately, the bull does not give up and press higher in May. The upward momentum produced after strong quarterly result by the company.
The company reported earnings per share of $2.72 vs. $2.68 expectation. Revenue comes out at $61 billion vs. $61.1 billion expectation. It is revealed, Berkshire Hathaway the company owned by Warren Buffet bought 75 million shares of AAPL in Q1 which help the share prices jumped.

Will we see the company continue its strong performance?
Click here to read AAPL Previous analysis
New Month
Monthly chart
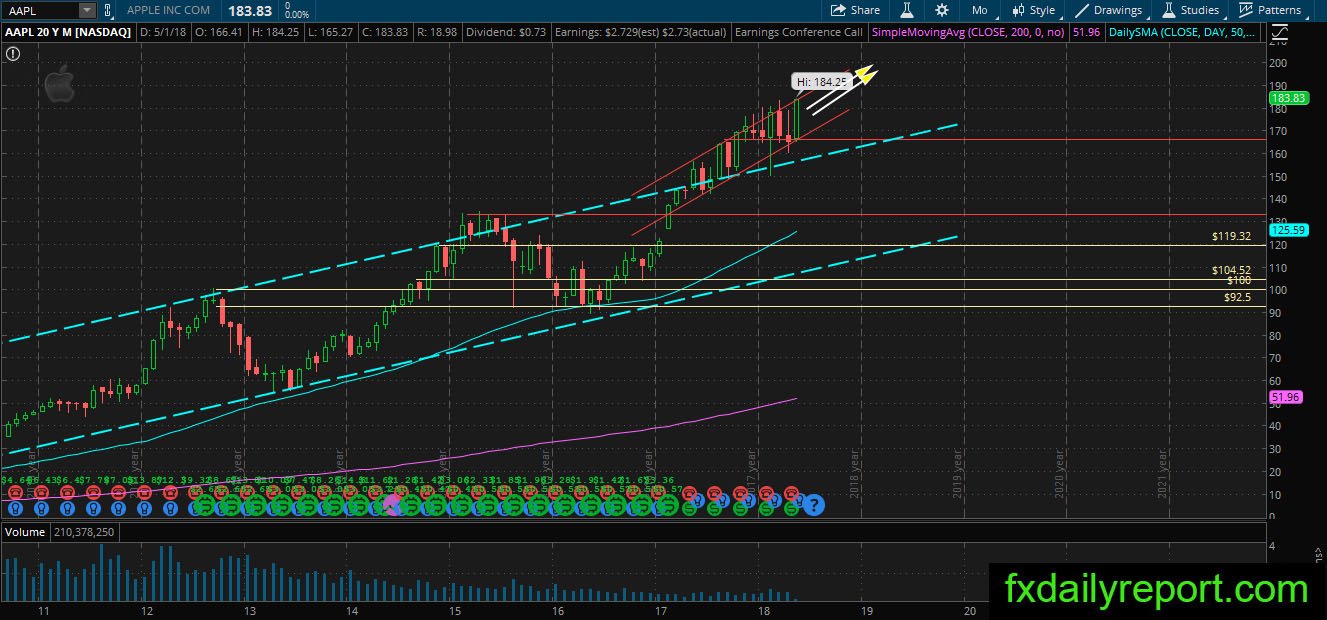
The only direction shown on AAPL monthly chart to the upside, and there is nothing to change the trend yet. This month, the share prices print a new record high and have the chance to continue further upside. Traders might want to stay sideways for now until a trend changing pattern formed.
Weekly chart
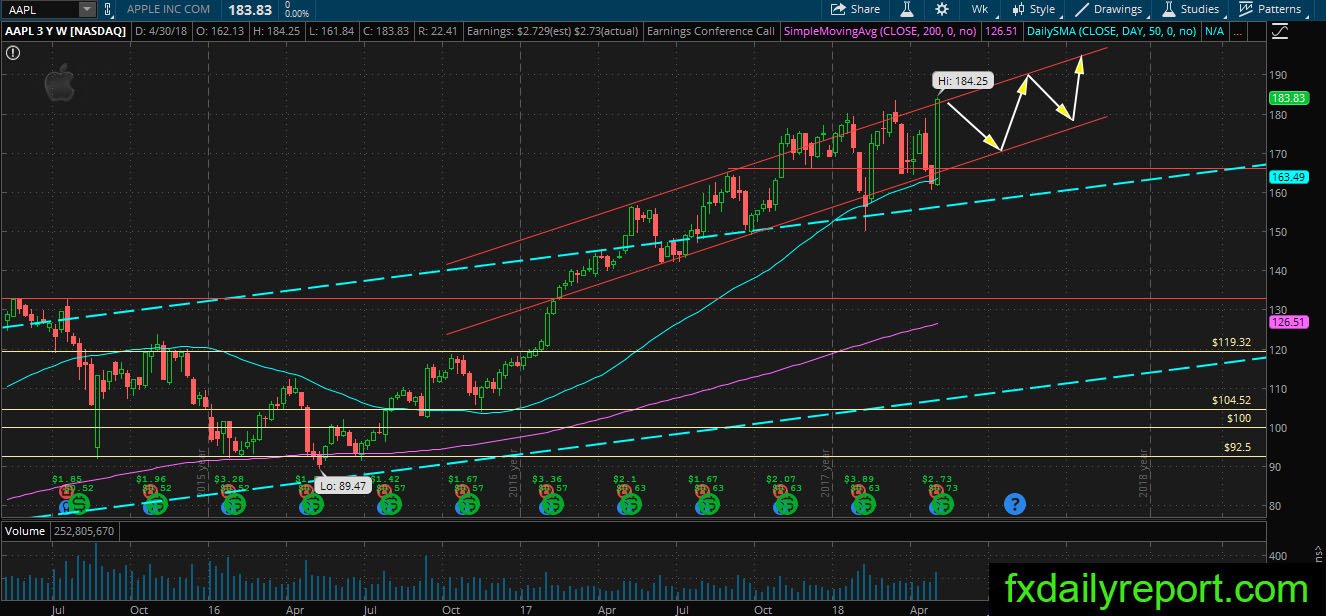
AAPL on the weekly chart jumped in the latest week and might continue upside as the candlestick pattern is a marubozu which is a full bullish candlestick. There is the red bullish channel on the chart, will the share prices respect the channel and contained inside it?
Daily chart
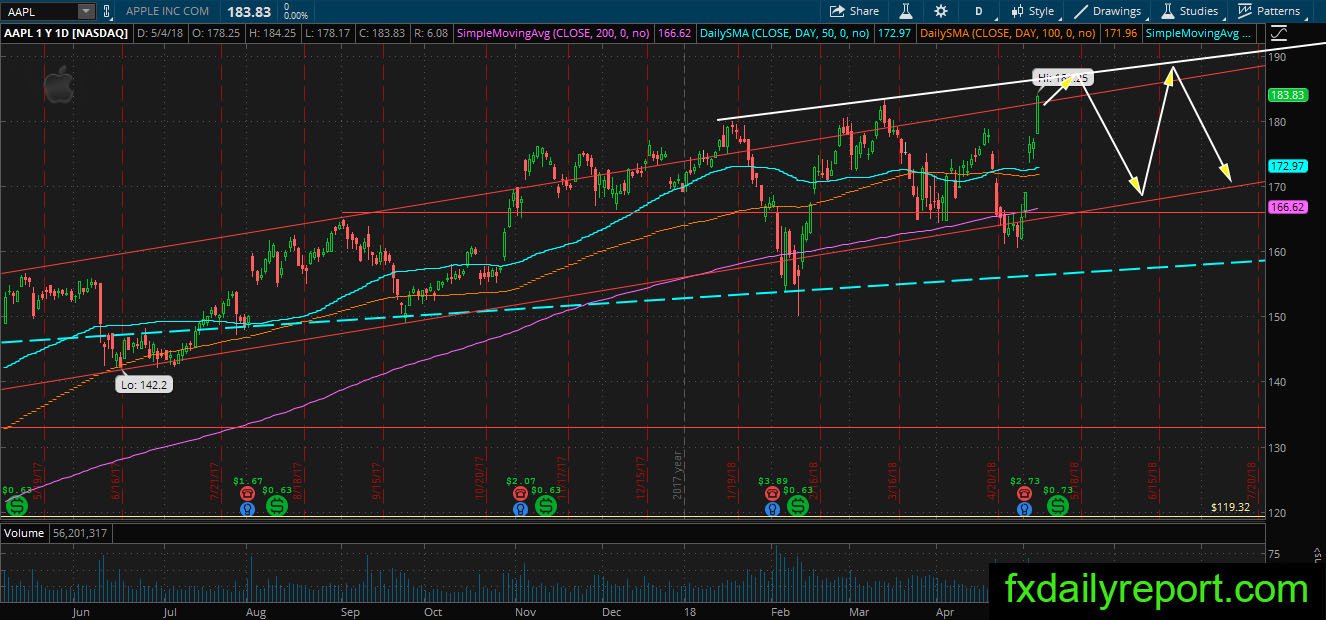
The extreme bullish pressure was seen on AAPL daily chart, the bull running wild after the company reported strong earnings result. The bullish run might encounter white trendline resistance and take a downward turn. However, it is also possible the bullish pressure break through the resistance. Traders might want to stay sideline and wait for a strong bearish pattern before jump in short position.
Trade plan
Long position needs to wait until correction happen. The share prices are at high and could reverse anytime.
The short position needs to wait until strong bearish pattern near the white trendline resistance.