
AAPL Long-term outlook
AAPL hovered at $174.96 or 13.52% higher since the September close price of $154.12. The company also topped valuation of $900b. Calculated from the beginning of the year, AAPL logged more than 50% gain in share prices. What happens actually behind the company? Why do the share prices continue to move higher?
The advance of AAPL share prices mostly attributed to its iPhone launch. The market is expecting iPhone 8 and iPhone X which planned to be released in November. The expectation and result should bring more positive news for AAPL share prices until the end of the year. However, analyst grows concerned about the pace of share prices increase and expect correction will happen soon.

Click here to read October 2017 analysis
New Month
Monthly chart


We have nothing to analysis on AAPL monthly chart, only more encouragement for traders who push the share prices higher at the current level. It is an uncharted territory which is a low-odds area for the technical analyst. However, traders could hold to one principle, “The higher it climbs, the harder fall.” Let’s wait until AAPL share prices fall enter normalization period.
Weekly chart

The higher high and higher low on the weekly chart indicates the bullish trend of AAPL has not seen an end yet. The share prices could continue moving higher. If the share price corrected lower, it would move inside the red bullish channel.
Daily chart
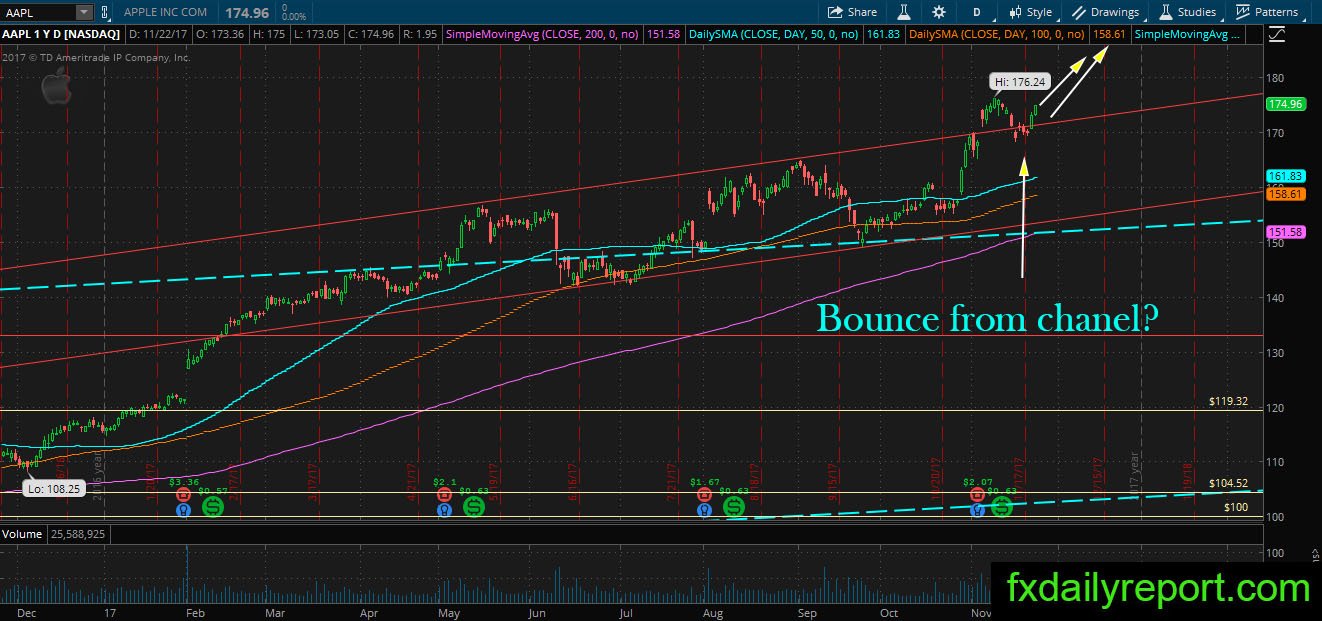
AAPL outlook on the daily chart is similar to the weekly chart. The share prices move near its channel, and there is a possible bounce from top of the channel. The upward trend could continue, and traders could stay sideline until strong bearish pattern emerge.
Trade plan
The long position might need to wait until significant correction happen. Traders could use red channel bottom on the weekly and daily chart as an entry for a long position.
The short position needs to wait until strong bearish pattern printed on the monthly or weekly chart.