
Natural gas has been consolidating inside a broad range since late July, bounded by resistance at $2.814 and support at $2.641.
Price recently broke down from the upper half of this range, sliding from the $2.750 region in mid-August down to retest the range floor near $2.641, where buyers have repeatedly stepped in to defend this level.

That bounce off support is still in its early stages, with price currently trading around $2.704 after climbing off the recent low. If the $2.641 floor continues to hold, natural gas could work its way back up toward the mid-range zone and eventually challenge the $2.814 resistance once more.
A break above that ceiling could open the door to a fresh leg higher, potentially unwinding the entire pullback from the early August highs.
On the other hand, a clean break below $2.641 could confirm a range breakdown, and given that the range spans roughly $0.17, a measured move selloff could drag price down to the $2.470 area or lower.
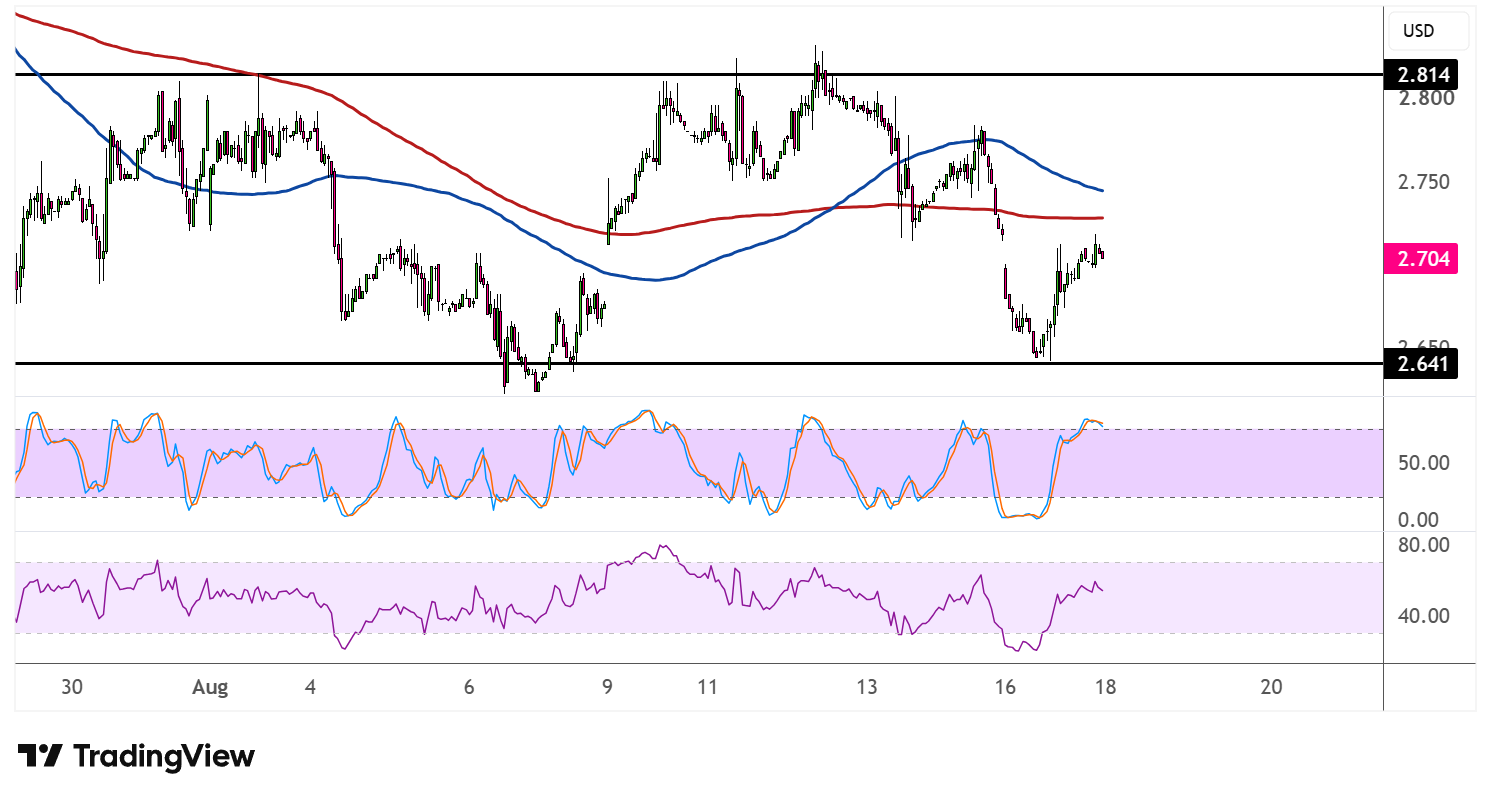
Looking at the moving averages, the 100 SMA had crossed above the 200 SMA in early August to reflect a shift in bullish momentum, but the two lines are converging again as the recent selloff dragged the 100 SMA lower.
A crossover back below the 200 SMA could signal that sellers are regaining the upper hand, while a bounce that keeps the 100 SMA above the 200 SMA would support the case for a move back to resistance.
Stochastic recently dipped into oversold territory before turning higher, reflecting the return of some buying pressure after the selloff ran its course. RSI is also curling upward from the lower half of its range, suggesting there could be more room to climb before overbought conditions are reached, allowing the bounce to gain a bit more traction in the near term.
Natural gas could take cues from inventory levels and weather forecasts, particularly as heat waves are being reported in Europe, though the upcoming FOMC minutes could carry more weight in terms of USD direction and overall sentiment.