
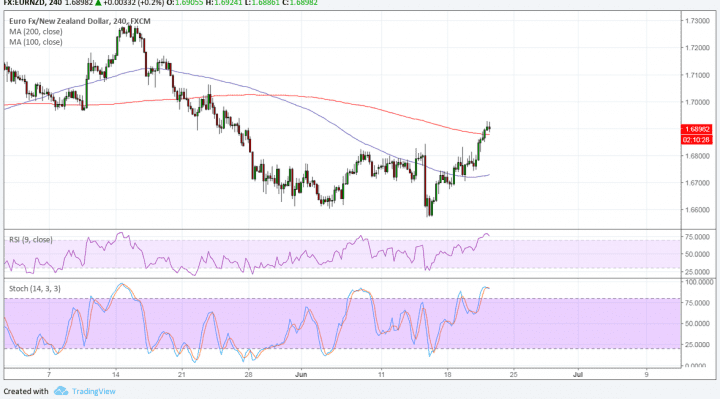
EURNZD appears to be done with its slide as it failed in its last two attempts to break below the 1.6600 handle. Price has then formed a double bottom pattern on the 4-hour time frame to suggest that an uptrend is underway.
The pair has already broken past the neckline of the formation at 1.6800 to confirm that an uptrend is taking place. Price could be in for a climb that’s the same height as the chart pattern or 200 pips.

However, the 100 SMA is still below the longer-term 200 SMA on this time frame to signal that the path of least resistance is to the downside. This indicates that the selloff is more likely to resume than to reverse. The 200 SMA is also being tested as a dynamic inflection point at the moment, and a break higher could signal a pickup in bullish momentum.
RSI is already indicating overbought conditions to show that buying pressure might fade soon. Turning lower could lead to a pullback to the broken neckline resistance, which might now hold as support. Stochastic is also in overbought territory to signal that buyers are tired and willing to let sellers take over.
There is some degree of selling pressure for the euro, though, as bulls were a bit disappointed by the ECB decision. Recall that the central bank said that they will simply be tapering QE versus cutting it off completely in December. Draghi also didn’t provide a specific timeline for tightening apart from citing that it could start in the summer.
However, the downside could be greater for the Kiwi if trade tensions between the US and China continue to escalate. After all, this could spillover to demand for commodity exports, something that the New Zealand economy is heavily dependent on.
New Zealand also reported another considerable dip in dairy prices during the latest auction, supporting odds that the RBNZ won’t be budging from its policy stance anytime soon.