
DIS Long-term outlook
A major change in Disney caused the share prices boom in April this year. The share prices finally conquer all-time high since August 2015. Most of the current upside in the share prices attributed to the company plan to launch its streaming service Disney+ with monthly pricing of $6.99. It means a full-scale battle between the company and the market leader Netflix (NASDAQ: NFLX) who has monthly pricing of $8.99
Aside from the streaming service. We have watched three major titles which deliver this year, the Avengers: Endgame, Captain Marvel and Alladin. More titles on the schedule such as Toy Story 4, Lion King, Frozen 2 and Star Wars.

Looking at the record it seems Disney still has much room upside.
New Month
Monthly chart
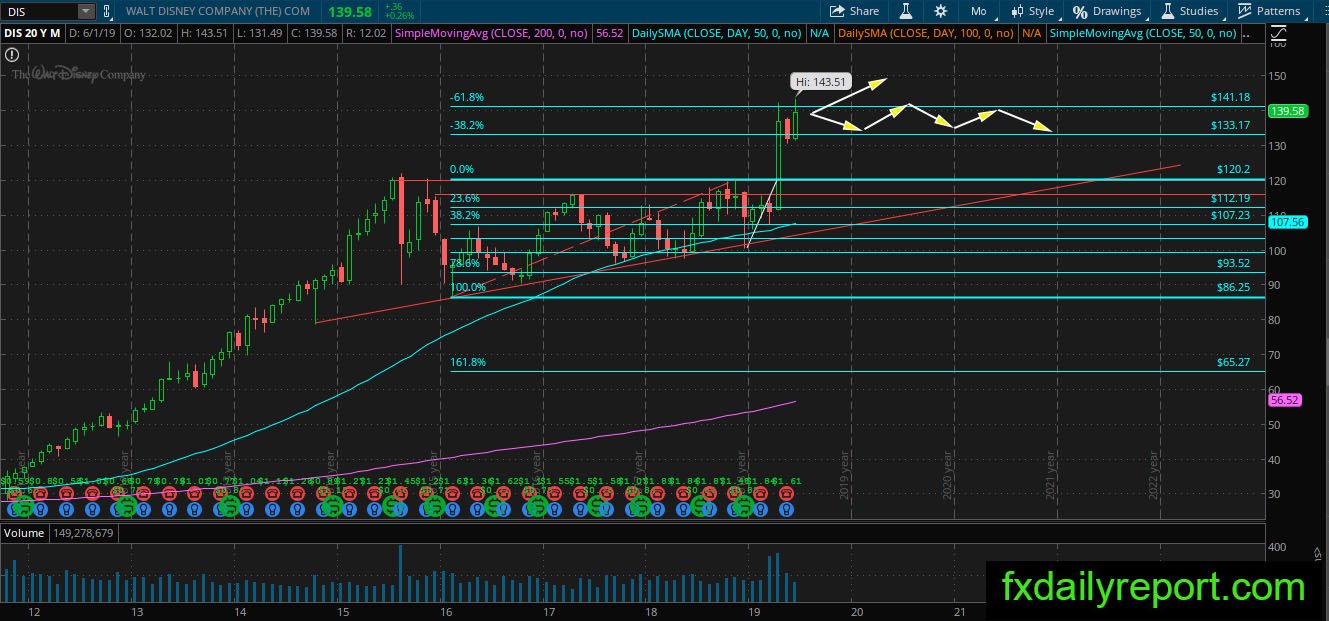
In April analysis, we mentioned about the bullish ascending triangle pattern and at the same month, the pattern confirmed. If traders hold long position then DIS share prices have confirmed bullish continuation on the monthly chart.
We drew a Fibonacci extension level of 38.2% and 61.8% where the share prices traded at the moment. While waiting for further bullish momentum, the share prices might consolidate between the Fibonacci levels.
Weekly chart
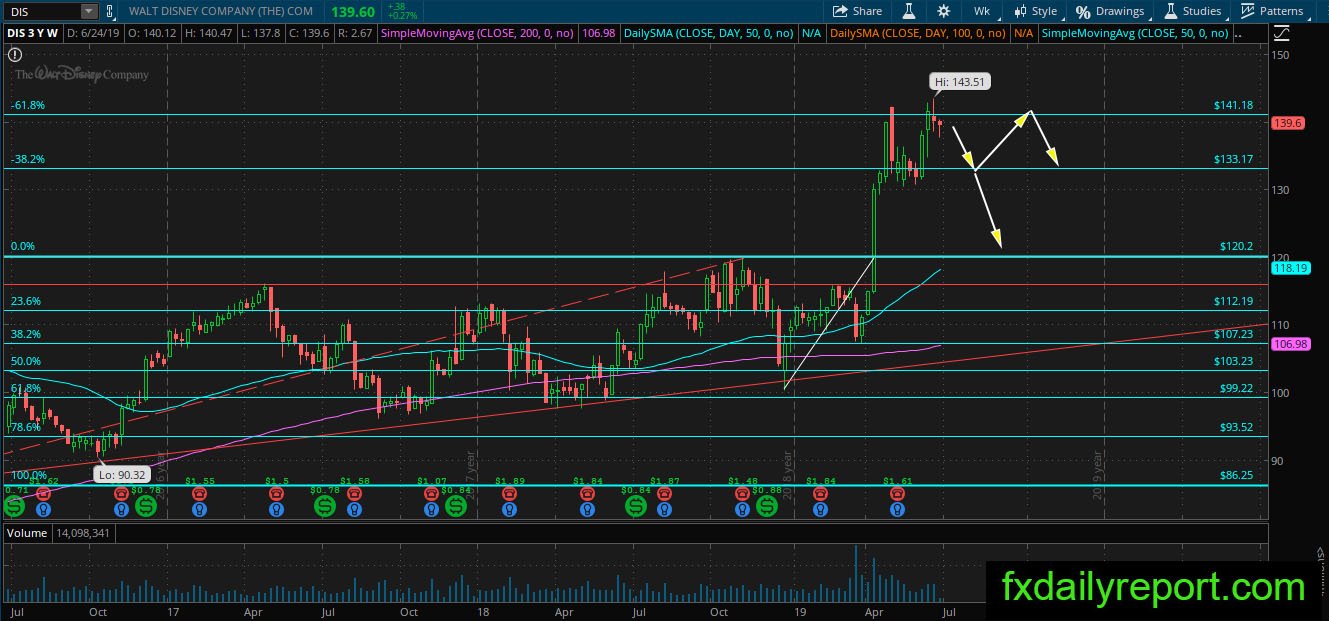
The best possible scenario to take long positions is when DIS fell below 38.2% Fibonacci extension level and reach $120.2 or the breakout point of ascending triangle pattern. It is a text-book trade and has a high probability chance of success.
A bearish correction toward $120.2 is highly unlikely which mean traders will keep watch on 38.2% or $133.17 for possible long positions.
Daily chart
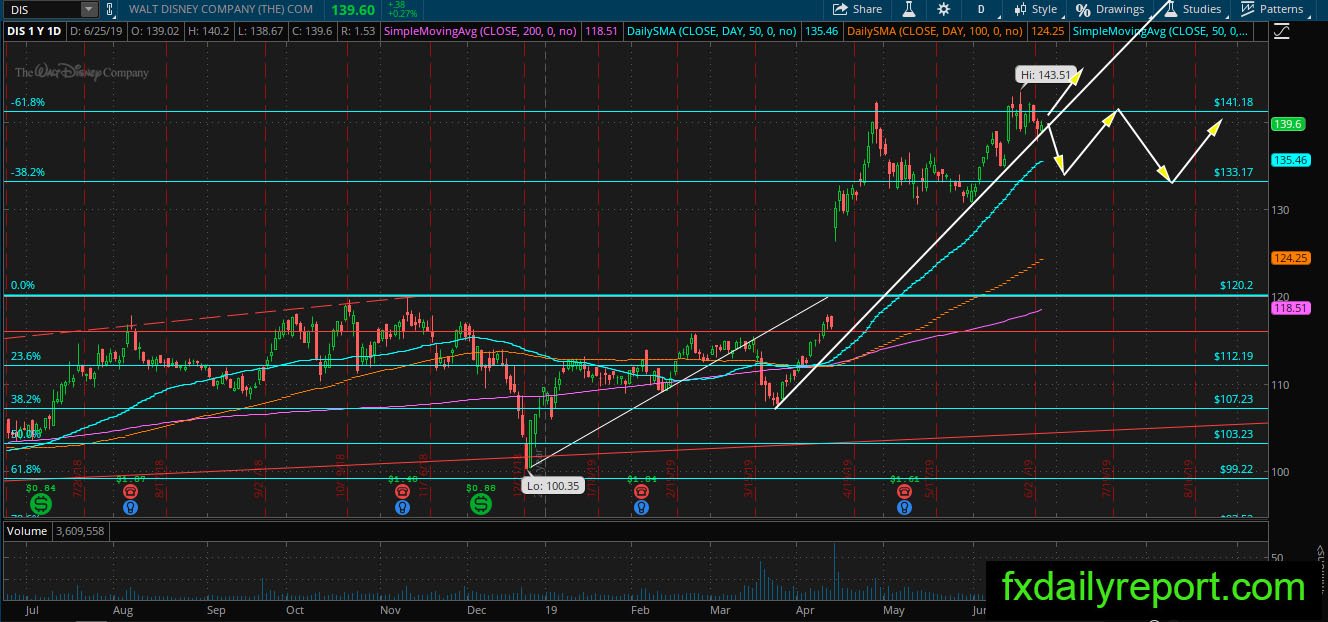
Not much difference between DIS daily chart, weekly chart, and the monthly chart. The share prices are at the bullish extreme level and might be ready for either breakout or bearish correction. On the daily chart, we have a steep bullish trendline and 61.8% Fibonacci extension level. Which one will hold-up?
Trade plan
Bullish trade, watch $120.20 for possible long if the share prices ever make it to the level. On the upside, 38.2% or $133.17 is another level to watch.
Bearish trade, 61.8% or $141.18 is the key level to watch. Strong rejection from the level will give traders a chance to scalp the movement toward $133.17.