
DIS Long-term outlook
Disney withdrawal from Netflix is preparing for a bigger plan. The company taking aim at the streaming service and set to launch Disney+ on November, 12. The price for subscription service announced at $7 monthly and $70 annually. (Netflix subscription is $8.99 per month in 2019)
The announcement is positive for the company and we could see a rally in the stock prices. At the current time, DIS share prices might continue higher and print fresh all-time high soon.
New Month
Monthly chart

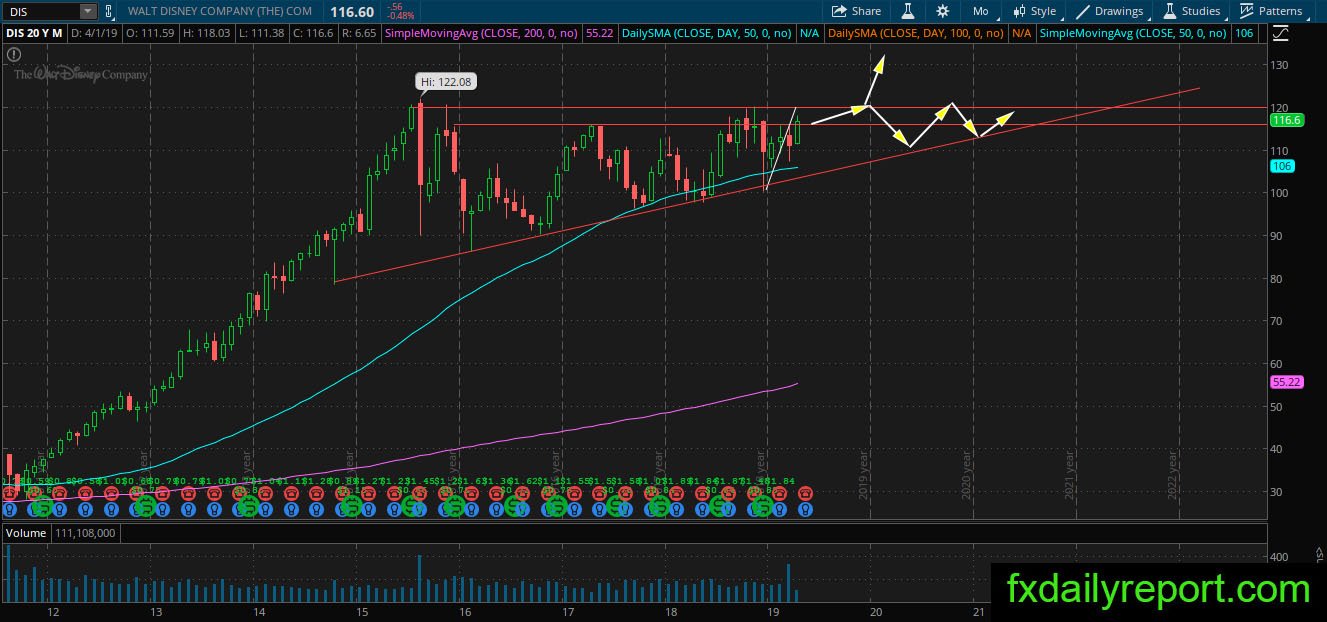
DIS slumped in the middle of March but manage to reverse before the month end. On the chart, the bullish ascending triangle is in play and this month the share prices have surpassed the previous month high. No change to the outlook and DIS expected to test the top of the triangle. Will a breakout or rejection happen at the top?
Weekly chart
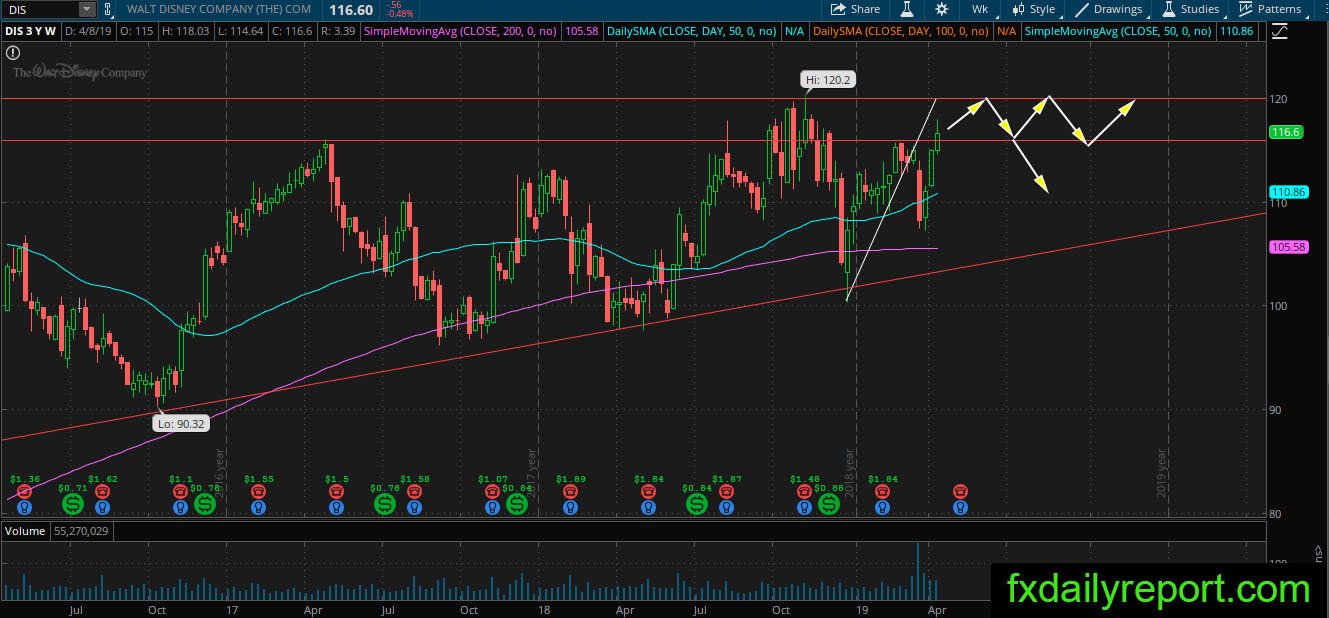
On the weekly chart, DIS almost reach the weekly SMA 200 in the previous drop. The share prices did not take long to reverse the bearish pressure and stage rally which continue until now. Will the bull continue to maintain the bullish pressure and push DIS to a new all-time high?
Daily chart
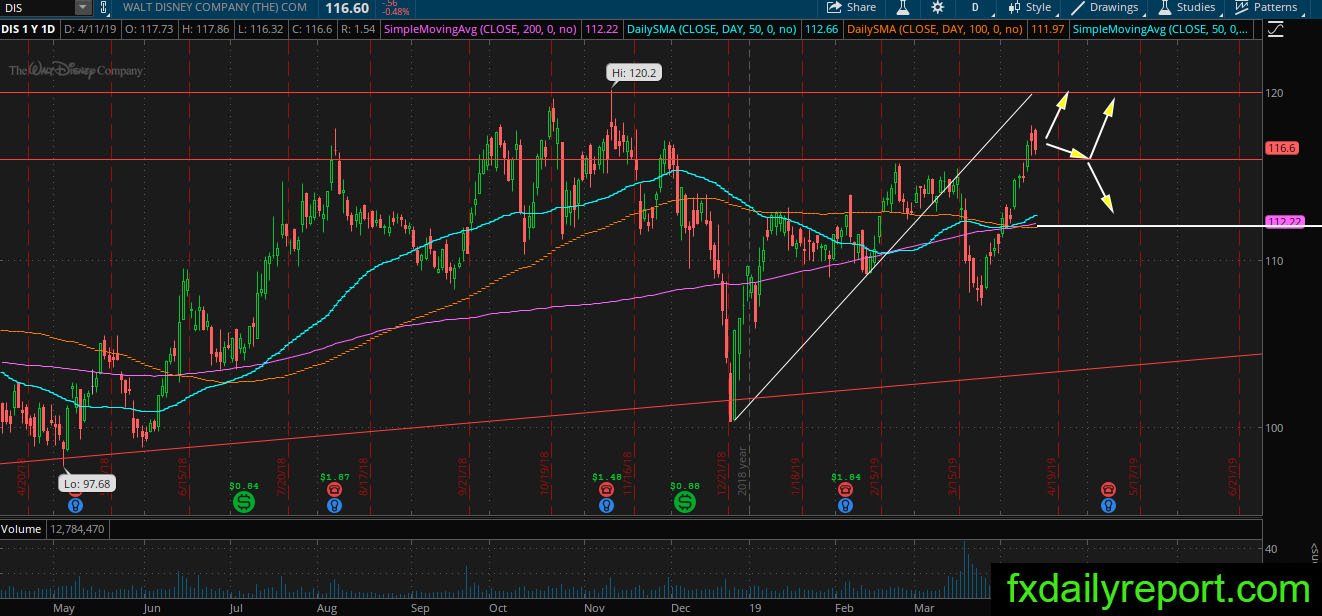
There was breakout below daily SMA 200 which should clear the long positions to hold by the bull. The breakout was convincing with lower low printed on the chart. However, the bull returns aggressively and DIS in a strong rally now. $116.00 – $116.60 will become the support level to watch.
Trade plan
Bullish trade, waiting near the bottom of the triangle shown on the monthly chart is the best options traders could take. (Same strategy)
Bearish trade, wait until there are reactions from $116.00 – $122.08 area. Shorting near the level will have the bottom of the triangle as a target.