
Gold no monthly breakout below $1,280
Although gold move bearishly in April, there was no monthly close below the support $1,280 which mean gold survived the sell-off. This month, there was bearish attempt to bring the price below $1,280 but the bull could maintain the level near the support.
Currently, the development of trade talks between U.S-China going haywire after President Trump threatened to raise tariff from 10% to 25% on 200b China imported goods this Friday. There are additional 325b goods inline for 25% tariff too after the implementation. China reacted negatively to the decision but still prepare for a scheduled talk which will happen on Wednesday this week.

Will we see a broke off on the trade talk? Alternatively, will we see both parties reach agreement and weather current fear in the market?
Click here to see Gold April 2019 forecast.
New Month
Monthly Chart
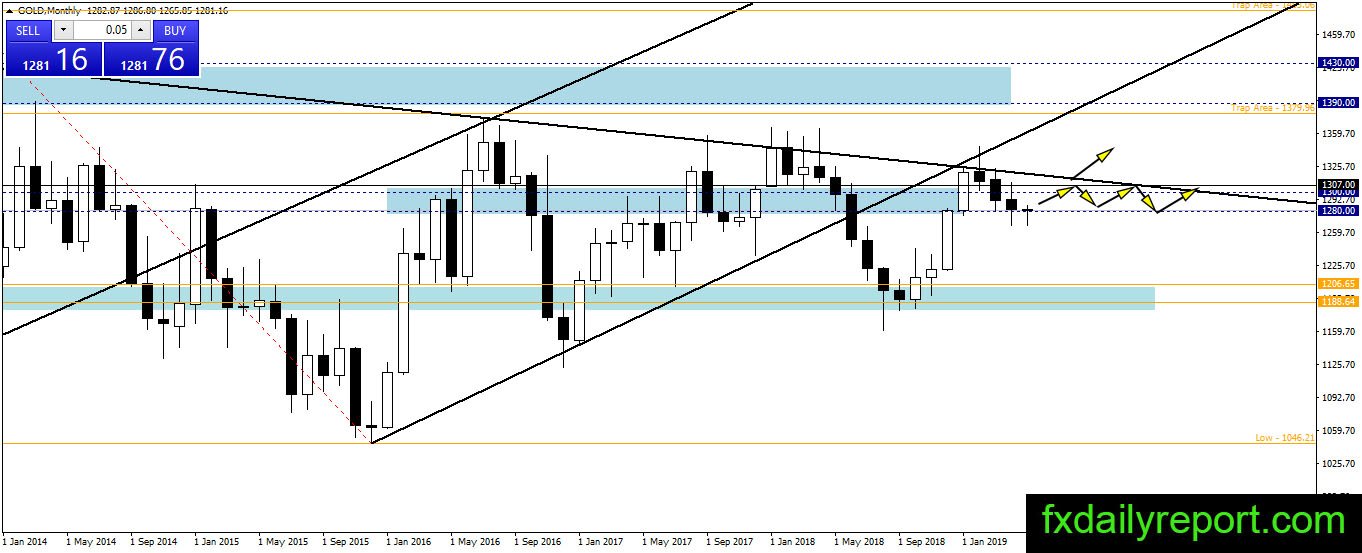
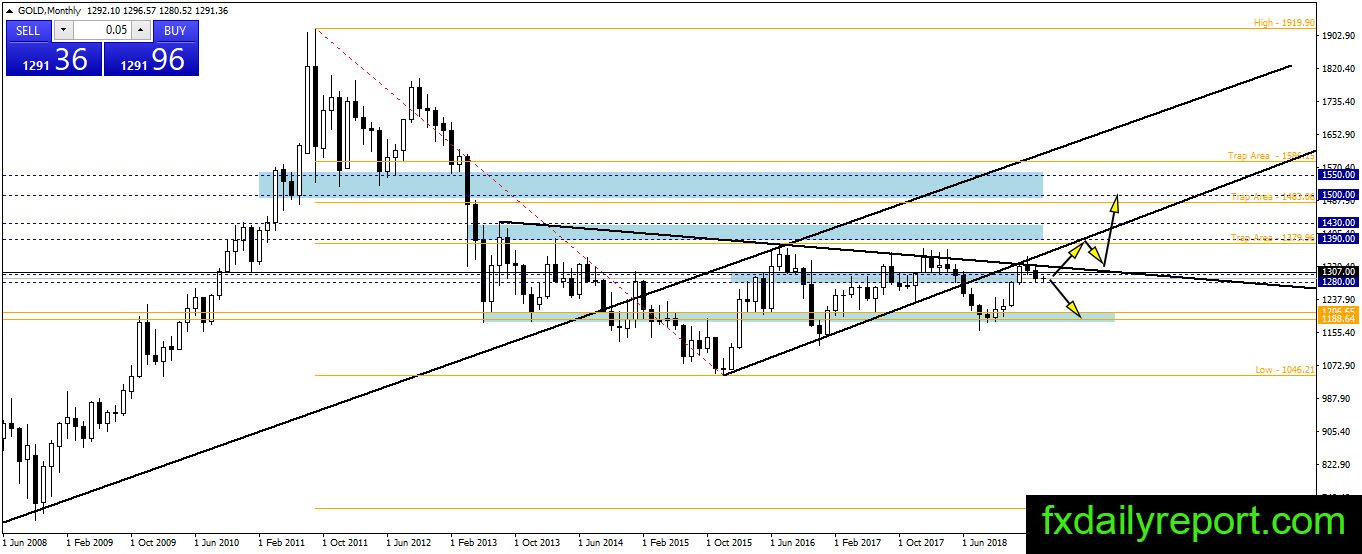
Rejection from the top trendline brought gold down for third months. Fortunately, the price avoided a close below $1,280 in the previous month. This month, there is an attempt to push the price lower but the bull manages to pull the price up above $1,280.
No conclusion yet on the gold next direction. It is possible the price will consolidate between $1,280 – $1,300 until breakout happens.
Weekly Chart
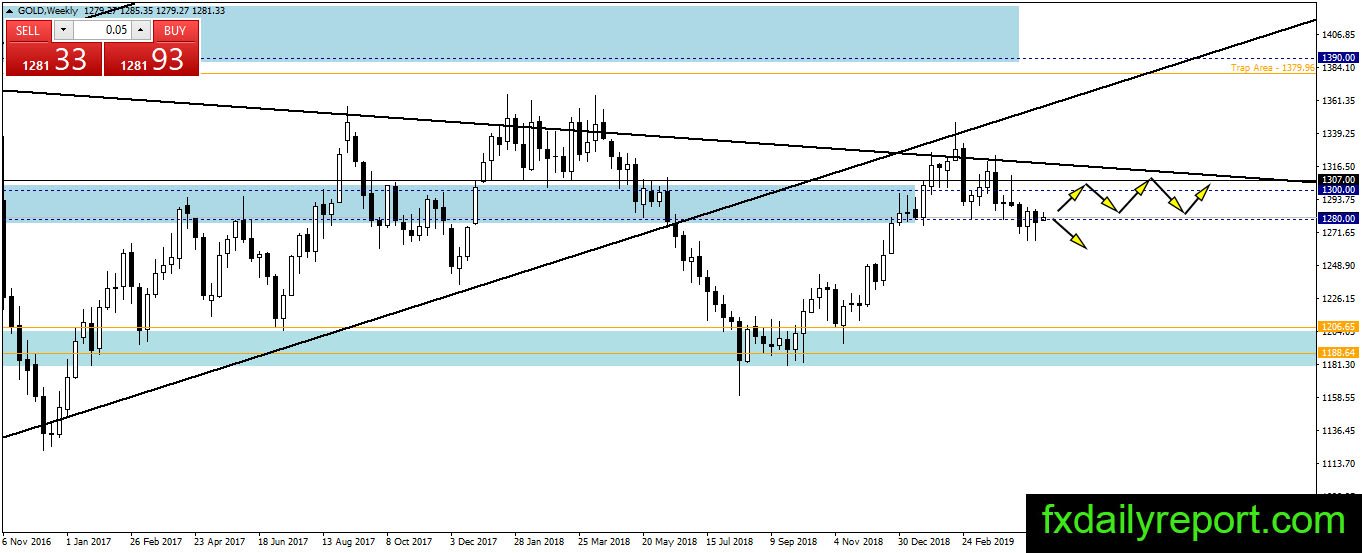
Similar to the outlook on the monthly chart, gold currently testing the support $1,280 and holding out near it. No major breakout happened yet and traders could enter small long positions at $1,280 with $1,300 as the target. A breakout above the trendline and $1,300 will help gold turn more bullish in the future.
Daily Chart
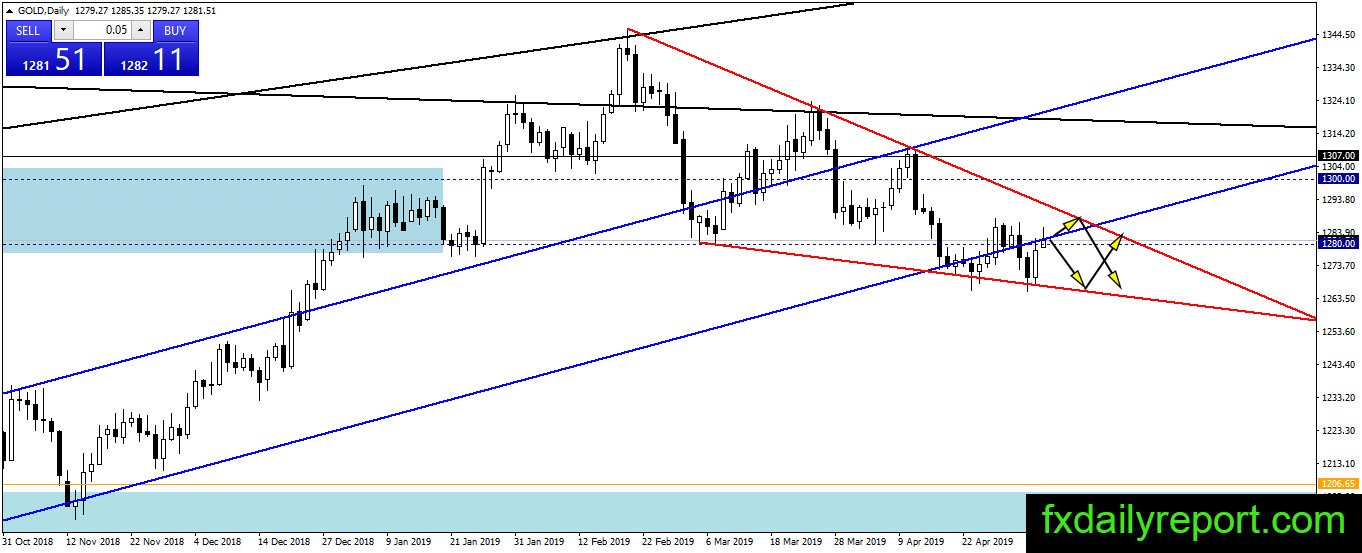
The low gets lower and the high gets lower, it is the best representation of bearish trend and it happen in gold prices. At the current time, the bull trying to bring the price to close above $1,280. The overall projection of the price movement is between two red trendline. Short positions are favored than long positions as long as the price stays between two trendlines.
Trade Plan
Bullish trade – Wait until a breakout and retest of $1,280 happen before entering long positions. Best confirmation is when the price climb above the red trendline on the daily chart.
Bearish trade – Short position to consider is short when breakout below $1,280 happen. (same strategy)