
Gold testing support $1,280
Another bearish month for gold in March after the price fell below February low and close below $1,300. It could be a temporary bearish reaction as the precious metal challenging its resistance. Overall, traders and investors are limiting major positions before Brexit final decision and U.S-China trade talk result.
Nothing much to expect yet when major events will take places this month. However, $1,280 is the key level to watch this month. A lower close below the level could trigger sell-off in gold.

Click here to see Gold March 2019 forecast.
New Month
Monthly Chart
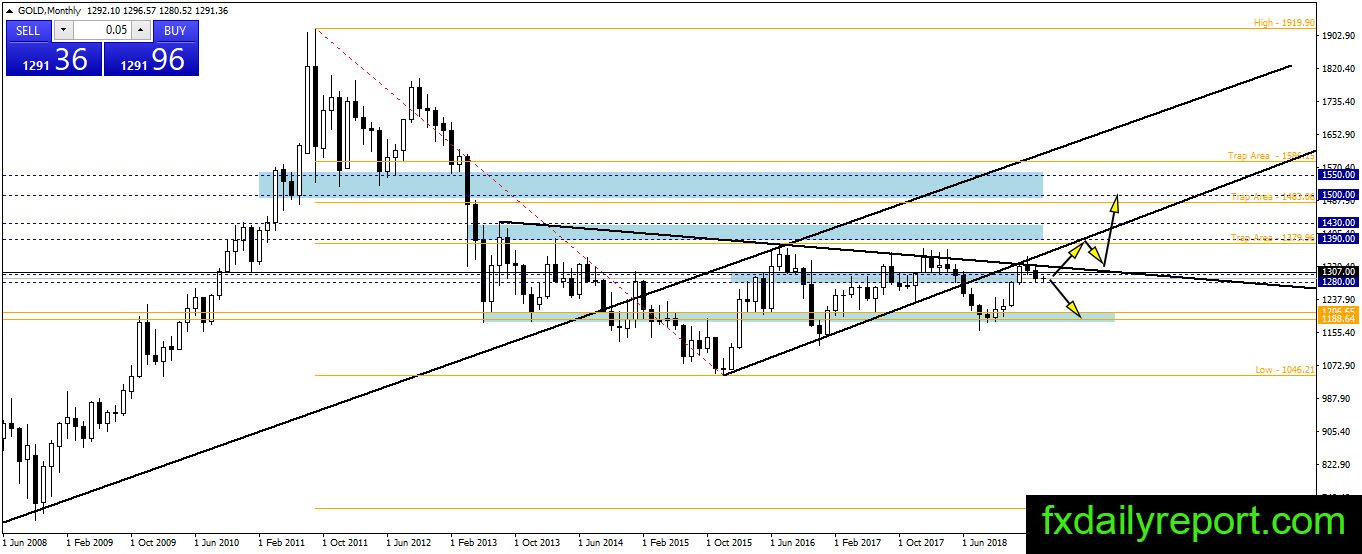
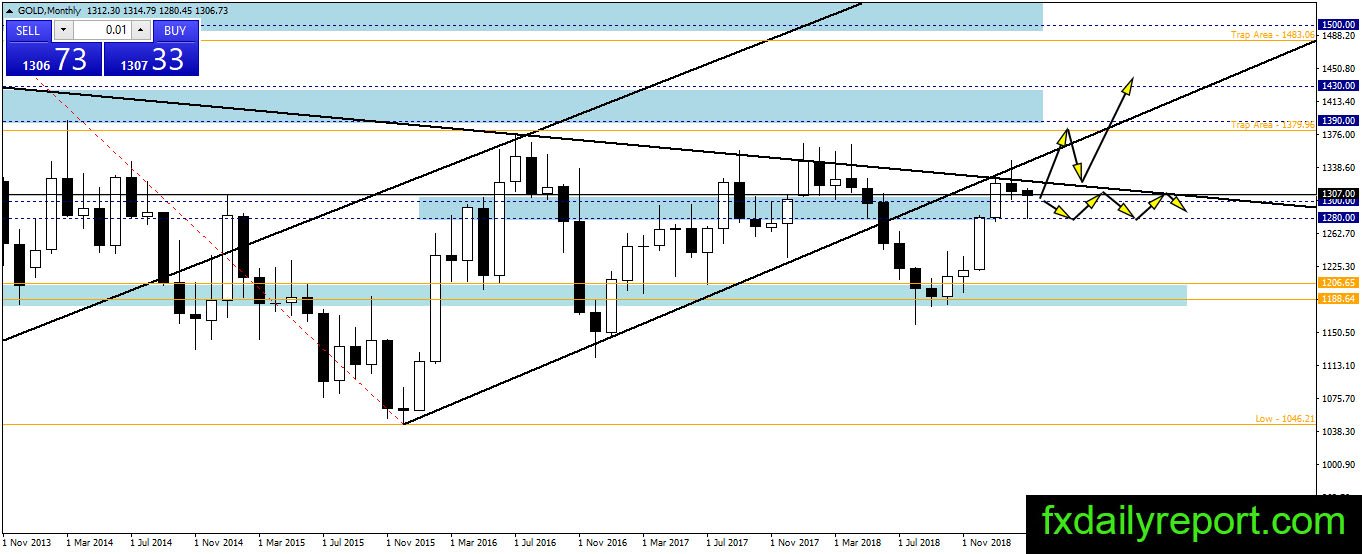
Gold experienced mild rejection from the trendline on the monthly chart and closed below $1,300 in March. The situation is bearish but it could be regarded as profit-taking action. As long as the price maintain the level above $1,280 then the precious metal set to breakout higher.
At the current time, traders could watch $1,280 as the level to take long positions. A breakout below the level will trigger sell-off and bearish continuation.
Weekly Chart
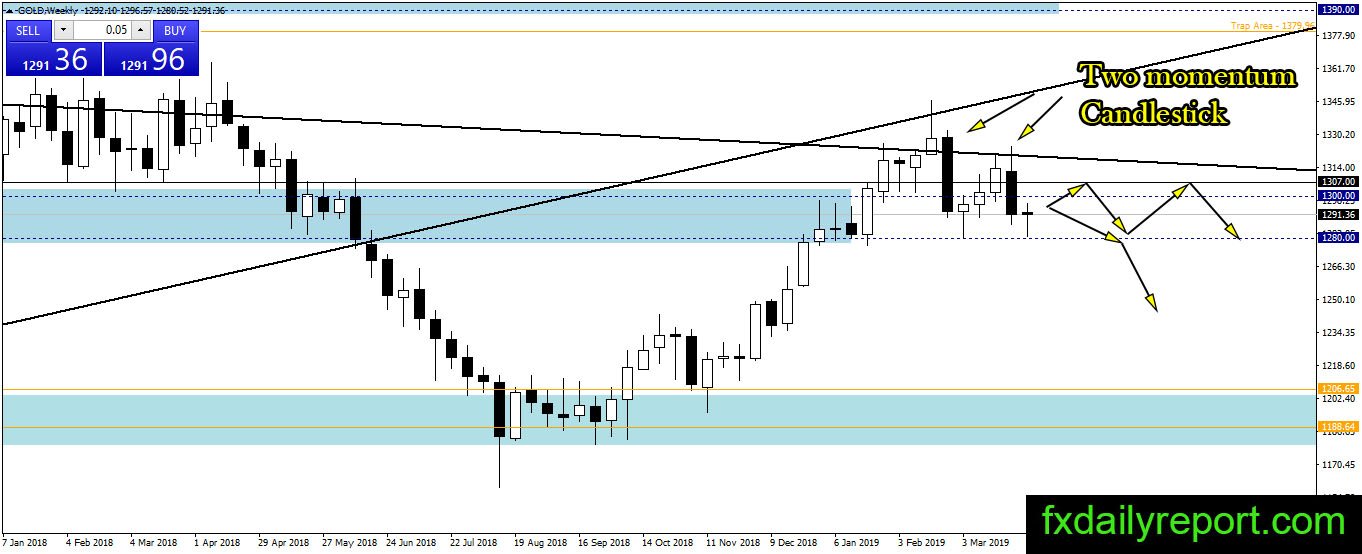
Two bearish momentum candlestick is not a good sign for the bull on the weekly chart. It took only one bearish candlestick to erase more than three bullish candlesticks which mean the bear is strong. Fortunately, no breakout below $1,280 happened. As long as the price stay above $1,280 the bull still has a chance to breakout higher.
Daily Chart
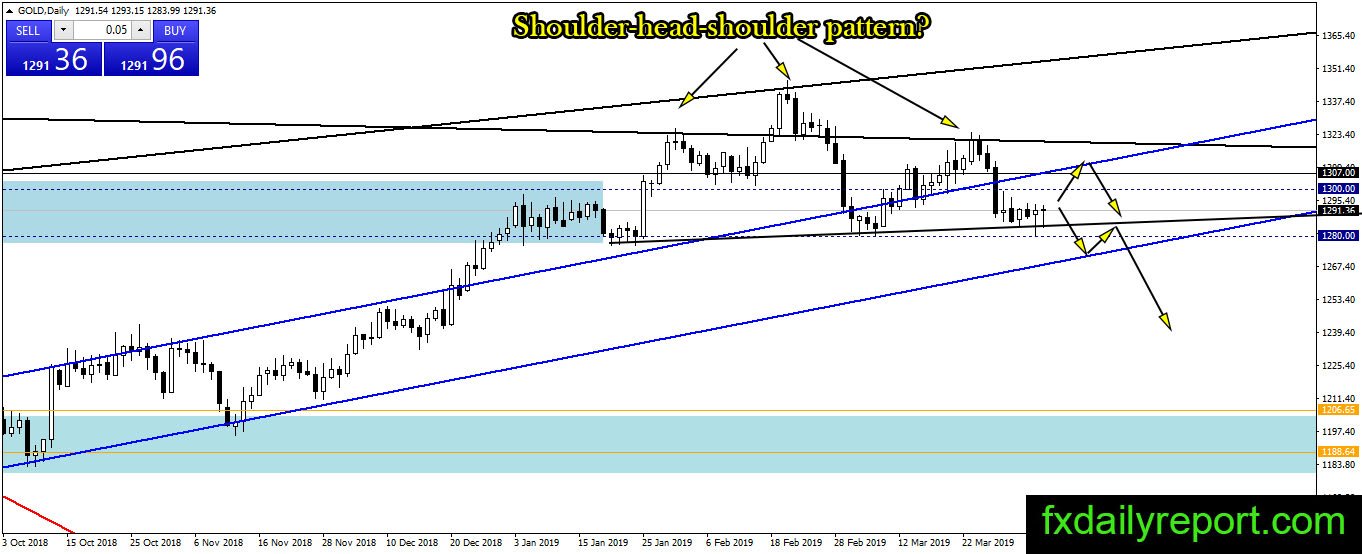
Stay cautious is the message shown on the daily chart. There was a possible shoulder head shoulder pattern with $1,280 as the neckline. The situation aligned with the situation on the weekly and monthly chart. A breakout below $1,280 is the scenario the bull want to avoid at all cost. Meanwhile, successful bounce from the level and close above right shoulder will cancel the pattern.
Trade Plan
Bullish trade – Traders could use $1,280 as the level to take long positions with a tight stop below it.
Bearish trade – Short position to consider is short when breakout below $1,280 happen.