
Gold climb on uncertainties
February might be a bearish month for gold but the situation changes drastically in March as major events take places. We have U.S-China trade talk negotiations under progress since the beginning of the month. On the other side, UK also struggling to decide on the countries futures after Brexit.
Recently, UK MP downvoted Theresa May Brexit deal proposal for the second time. It means the country might go down the path of “No deal”. But, it is also possible lawmaker decide to “Delay Brexit” before the due time.

Click here to see Gold December 2018 forecast.
New Month
Monthly Chart
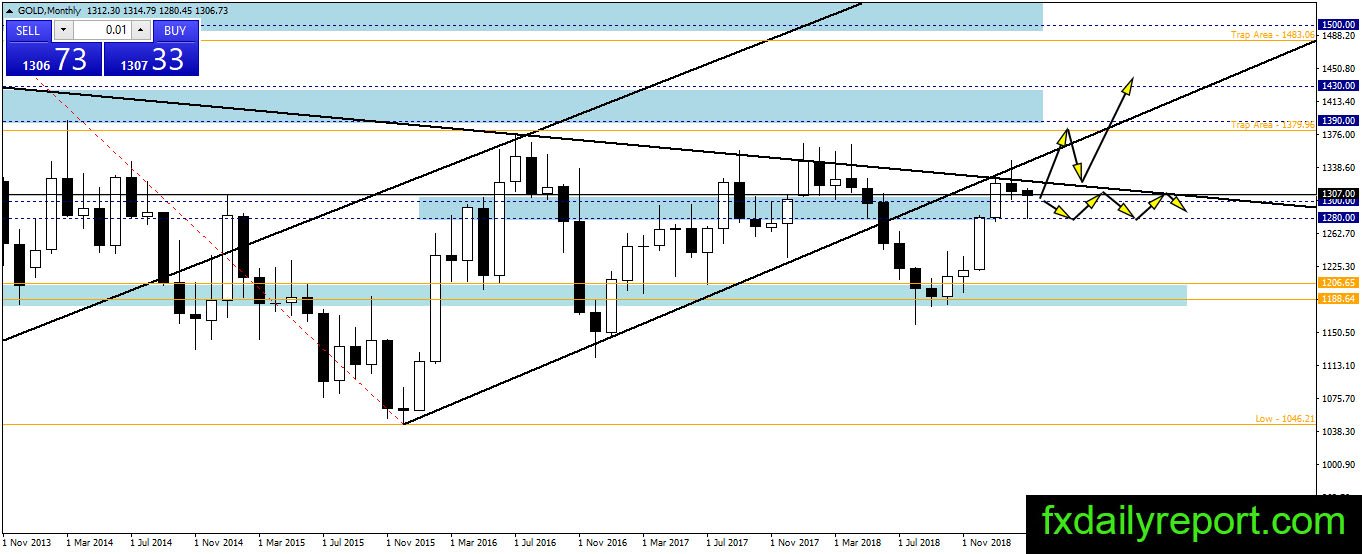
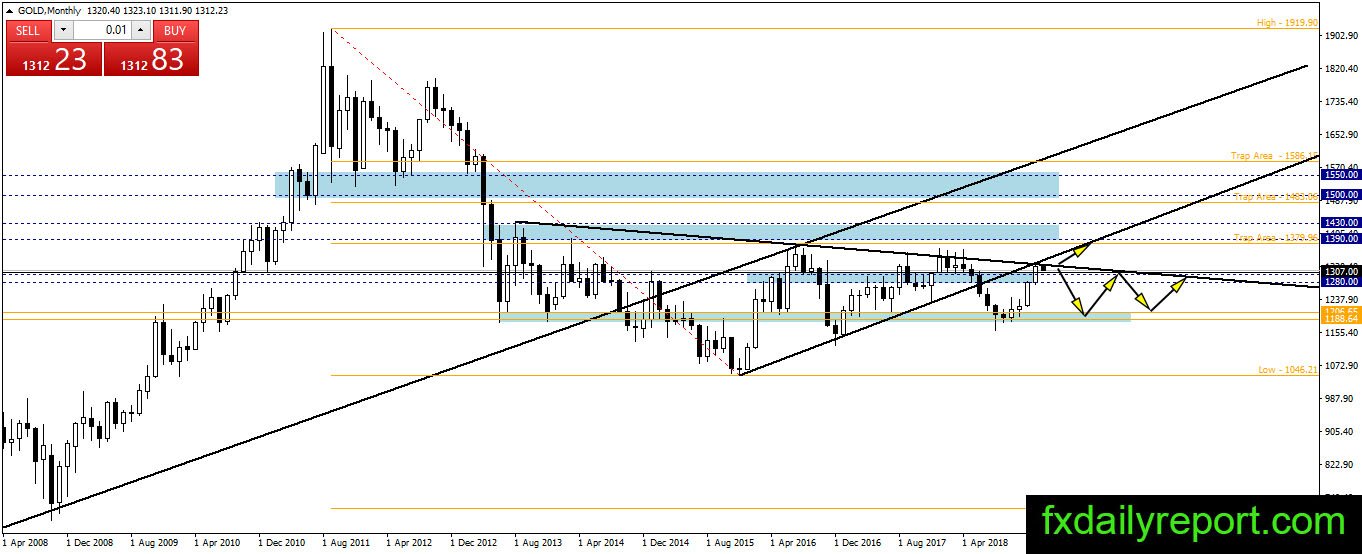
Gold lost its bullish momentum last month and show a bearish pattern when making an attempt to break above the bearish trendline. However, the price maintains a close above $1,300 which open the potential for a breakout in the coming month. This month, the bearish pressure pushed the price lower below $1,300 and test the level near $1,280.
Currently, the price bounced and traded above $1,300 which is good news for the bull. If gold could maintain the close above $1,300 by the end of the month then we might have a breakout next month.
Weekly Chart
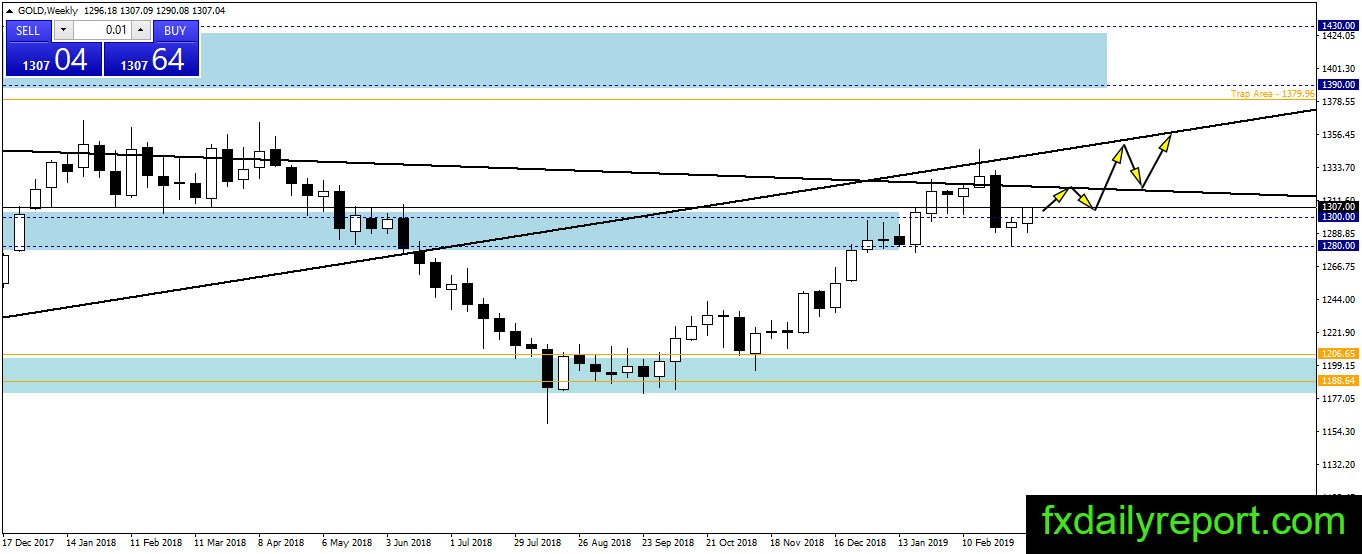
No breakout below $1,280 which mean no reason to take short positions in gold. The price bounced from $1,280 support level and this week move above $1,300. The outlook is similar to the outlook on the monthly chart. Gold should continue higher and test the trendline for a breakout.
If breakout happens then we might have a bullish trend toward $1,390. On the other hand, $1,280 still play an important part. As long as there is no breakout below the level then gold should stay on bullish track.
Daily Chart
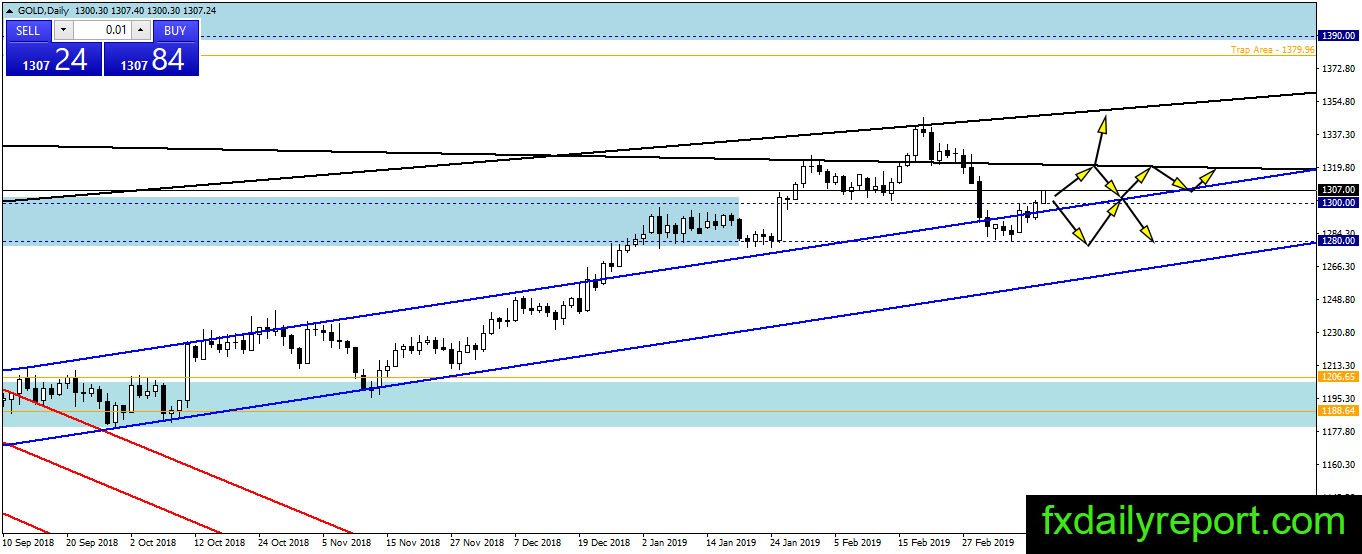
The situation on the gold daily chart is mixed but the overall long-term trend is bullish. Currently, the price attempting to make a significant close above $1,300. Will the price maintain the close above $1,300 by the end of the day?
Trade Plan
Bullish trade – Traders could use $1,280 – $1,300 area to look for long positions. (Same strategy as previous month)
Bearish trade – Short position could be taken near the bearish trendline shown on all charts above. Another short position to consider is short when breakout below $1,280 happen. (Same strategy as previous month)