
Gold higher close
Gold notch second monthly gain after the precious metal found support at $1,180 – $1,200 area. It closed above $1,220 in November and prompt further upside. However, the overall trend of the precious metal stay bearish and might not close far from current level.
December price movement might be influenced more from the fundamental side. In this month, The Fed will set interest-rate and give guidance for next year rate. At the start of the month, President Trump and China Xi Jinping will engage in trade talks. A deal or no deal is watched by the market. Lastly, OPEC meeting at the beginning of month also will set the global tone on oil trend.

Click here to see Gold October 2018 forecast.
New Month
Monthly Chart
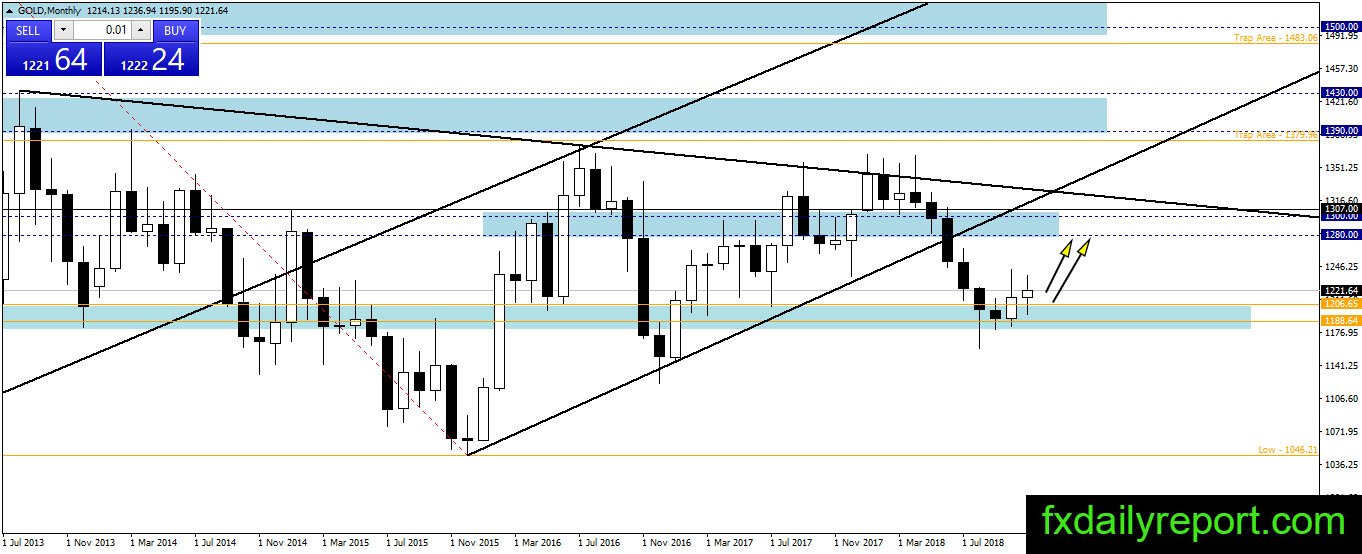
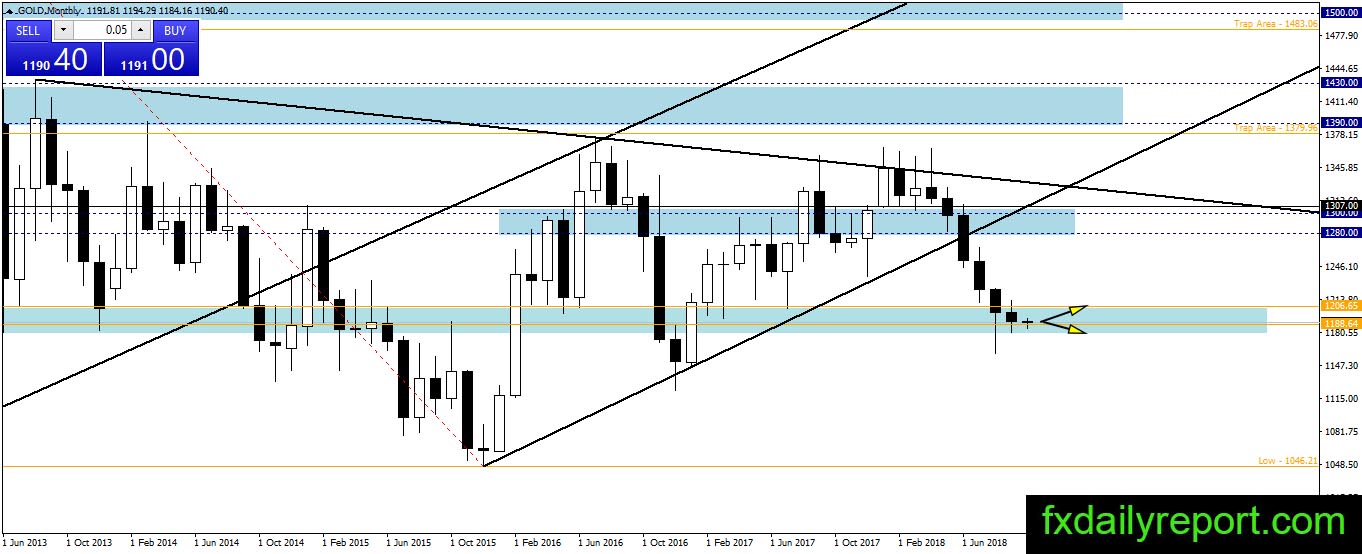
The bounce progress in gold prices slowly building up and we might have an upward movement from $1,180 – $1,200 area soon. If gold start moving higher then $1,280 – $1,300 will become the target. On the other hand, a slip below $1,180 will trigger sell-off and continuation of a bearish trend.
Weekly Chart
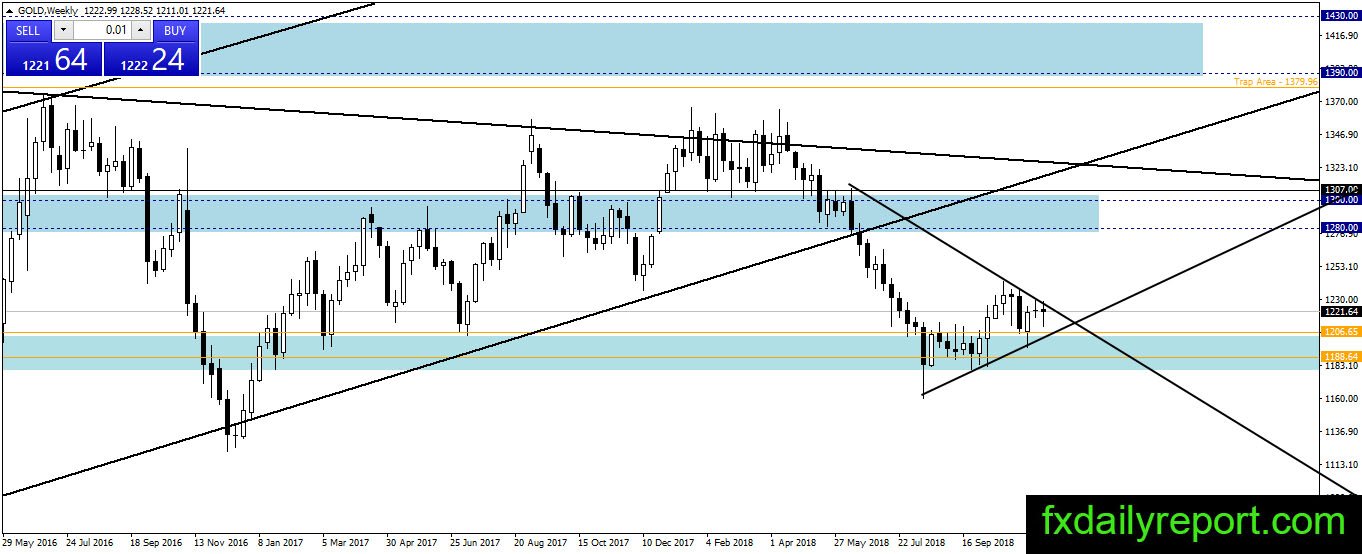
We have another triangle pattern to watch on the gold weekly chart. The price currently stays inside the triangle and due for a breakout. Which side will the breakout happen? Traders will wait for the breakout before placing any positions.
Daily Chart
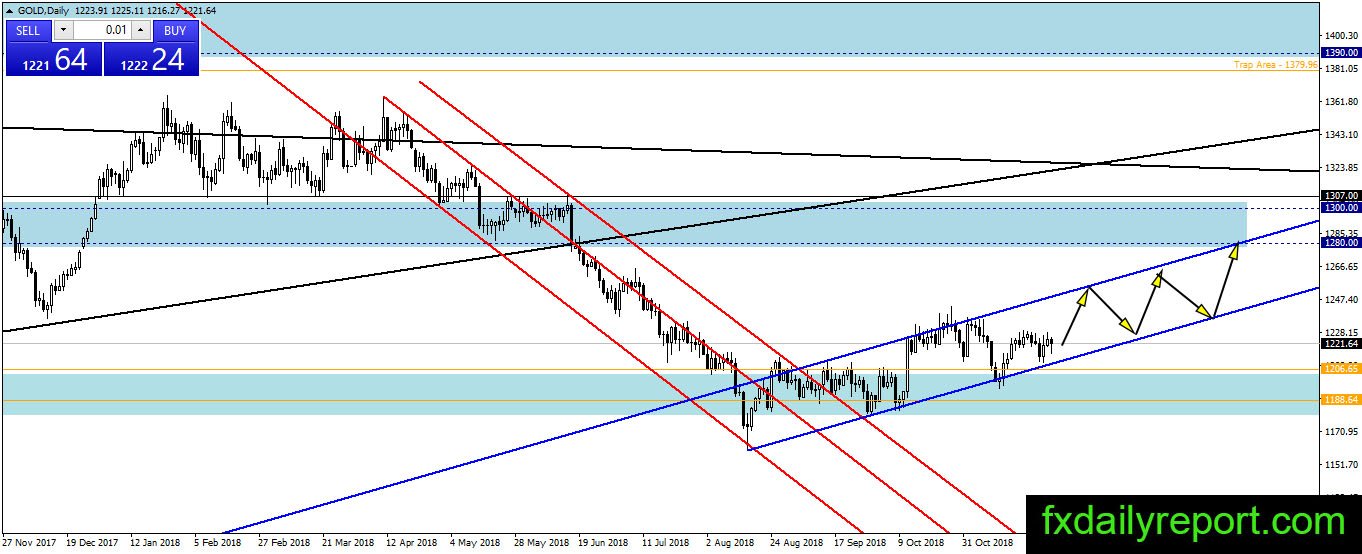
The bull manages to break out from the red bearish channel and bounce from $1,180 on the daily chart. It formed a blue bullish channel and proceed higher inside it. Traders could look for long position when the price testing the bottom of the channel and ride the upward movement with a stop below $1,180.
Trade Plan
Bullish trade – The bottom of the bullish channel on the daily chart is where traders will look for a long position.
Bearish trade – The short position need to wait until breakout below bullish channel on the daily chart or breakout below $1,180 happen. On the higher level, $1,280 – $1,300 is the area to watch for potential long-term short positions.