
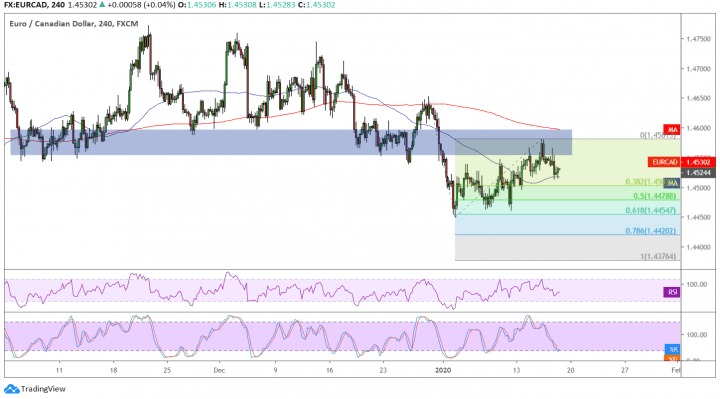
EURCAD recently broke through support around the 1.4600 handle and reached the 1.4450 minor psychological mark before pulling up. Price is retesting the broken support, which is currently holding as resistance.
If this keeps up, EURCAD could resume the slide to the downside targets marked by the Fibonacci extension tool. Price is nearing the 38.2% level at 1.4500 but could have enough bearish momentum to dip to the 50% extension around 1.4475. The 61.8% level lines up with the swing low near 1.4450 and could be a strong support zone. Sustained bearish pressure could take the pair down to the 78.6% level at 1.4420 or the full extension at 1.4375.

The 100 SMA is below the 200 SMA to indicate that the path of least resistance is to the downside or that resistance is more likely to hold than to break. However, the gap between the indicators is narrowing to reflect weaker bearish momentum and a potential bullish crossover. Price is also above the 100 SMA dynamic inflection point as an early indicator of bullish pressure.
RSI is still pointing down, though, so selling pressure could stay in play. Stochastic is also heading south so price could follow suit, but this oscillator is already approaching oversold conditions to signal exhaustion among sellers. Turning higher could suggest that buyers are about to take over.
The oil-related Loonie has enjoyed a lot of support from the commodity’s rallies as improving sentiment from the Phase One of the US-China trade deal lifted prices. Traders seem optimistic that tariffs on WTI crude oil could be lifted soon, which could bring in stronger global demand.
Meanwhile, data from Canada has been mostly upbeat as the economy added more jobs than expected in December, dashing hopes of a BOC rate cut anytime soon. On the flip side, the ECB minutes reflected some dovishness among policymakers, keeping a lid on the shared currency’s gains.