
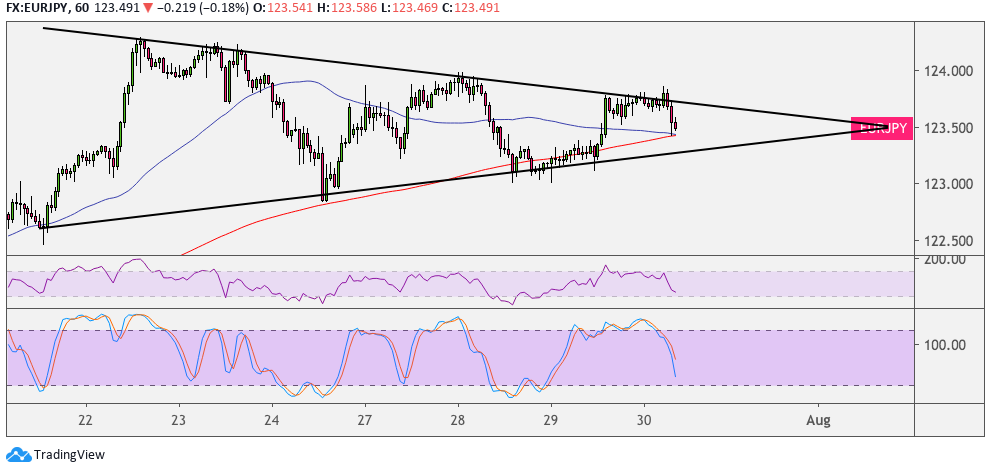
EURJPY has formed lower highs and higher lows to create a symmetrical triangle on is 1-hour chart. Price just bounced off the top and looks ready for a test of support.
The 100 SMA is above the 200 SMA for now to suggest that support is more likely to hold than to break. However, the gap between the indicators has narrowed enough to suggest a slowdown in bullish pressure and a likely bearish crossover.

In that case, a break below the triangle bottom around 123.50 could be followed by a drop of the same height as the chart formation, which spans around 150 pips.
RSI is heading lower to signal the presence of bearish pressure, and the oscillator has a bit of room to go before reflecting oversold conditions or exhaustion among sellers. Stochastic is also on the move down, so price could keep following suit until the oscillator reaches oversold levels.
Traders appear to be holding out for bigger headlines these days, particularly when it comes to stimulus efforts from governments and central banks dealing with the impact of the pandemic. Geopolitical tensions have also been in play, dampening demand for higher-yielding currencies.
The upcoming US advance GDP release might provide some volatility for forex pairs, including EURJPY, as this could impact overall market sentiment. A double digit contraction of roughly 35% is eyed for Q2 as most states were in lockdown mode during the first couple of months in the quarter, and several businesses were forced to close shop.
Stronger than expected data, however, could keep traders optimistic that the global economy could weather the pandemic and see a recovery sooner rather than later. A larger contraction, on the other hand, could prompt another flight to safety which tends to benefit the lower-yielding yen.