
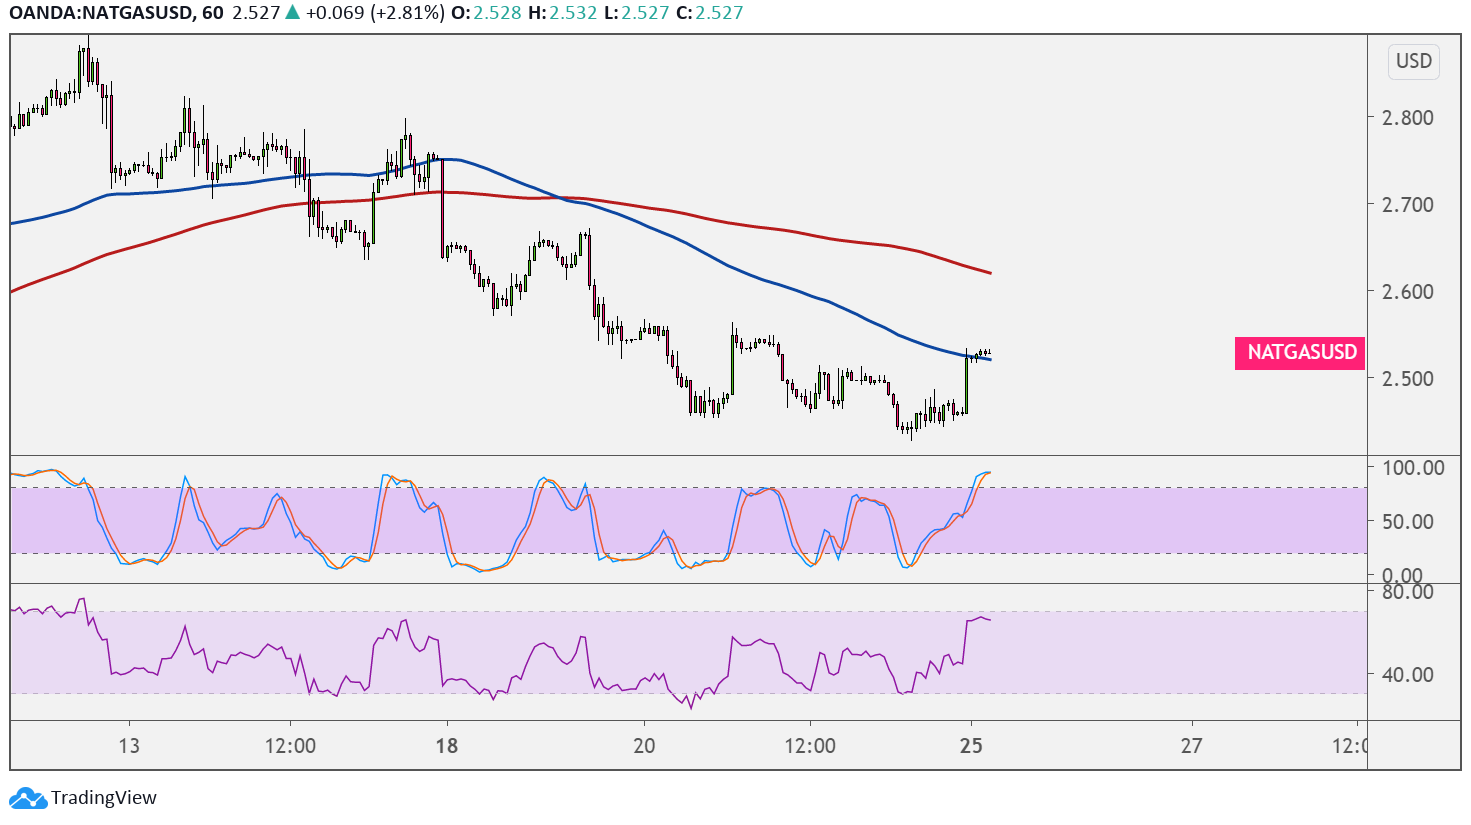
Natural gas might be done with its slide as the commodity formed a complex double bottom on its 1-hour chart. Price has yet to break past the neckline to confirm that a reversal is due.
However, technical indicators are suggesting that the selloff is more likely to resume. The 100 SMA is below the 200 SMA to indicate that the path of least resistance is to the downside or that bearish momentum is still in play. Price is testing the resistance at the 100 SMA dynamic inflection point, and a break above this could still hit a ceiling at the 200 SMA.

The gap between the indicators is also widening to reflect strengthening selling pressure. Stochastic is in the overbought zone to signal exhaustion among buyers and a potential takeover by sellers. If that happens, natural gas could slump back to the latest lows near $2.400.
RSI is already turning lower without indicating overbought conditions, suggesting that sellers are eager to return.
Natural gas drew a boost over the weekend but might be having difficulty sustaining its climb as weather agencies continue to predict warmer than usual temperatures for the coming days. This could mean weaker demand for the heating commodity even while supply levels remain elevated.
The upcoming inventory report from the Department of Energy could bring in volatility for the commodity as a large draw in stockpiles would signal stronger purchases while a draw could suggest that demand is feeble, which could mean more price declines.
In addition, traders would likely keep close tabs on weather forecasts as any material changes in temperatures could impact demand for the commodity. Warmer conditions could keep dampening purchases, which would keep a lid on natural gas gains, while cooling temperatures might lead to a strong rebound for the heating commodity.