
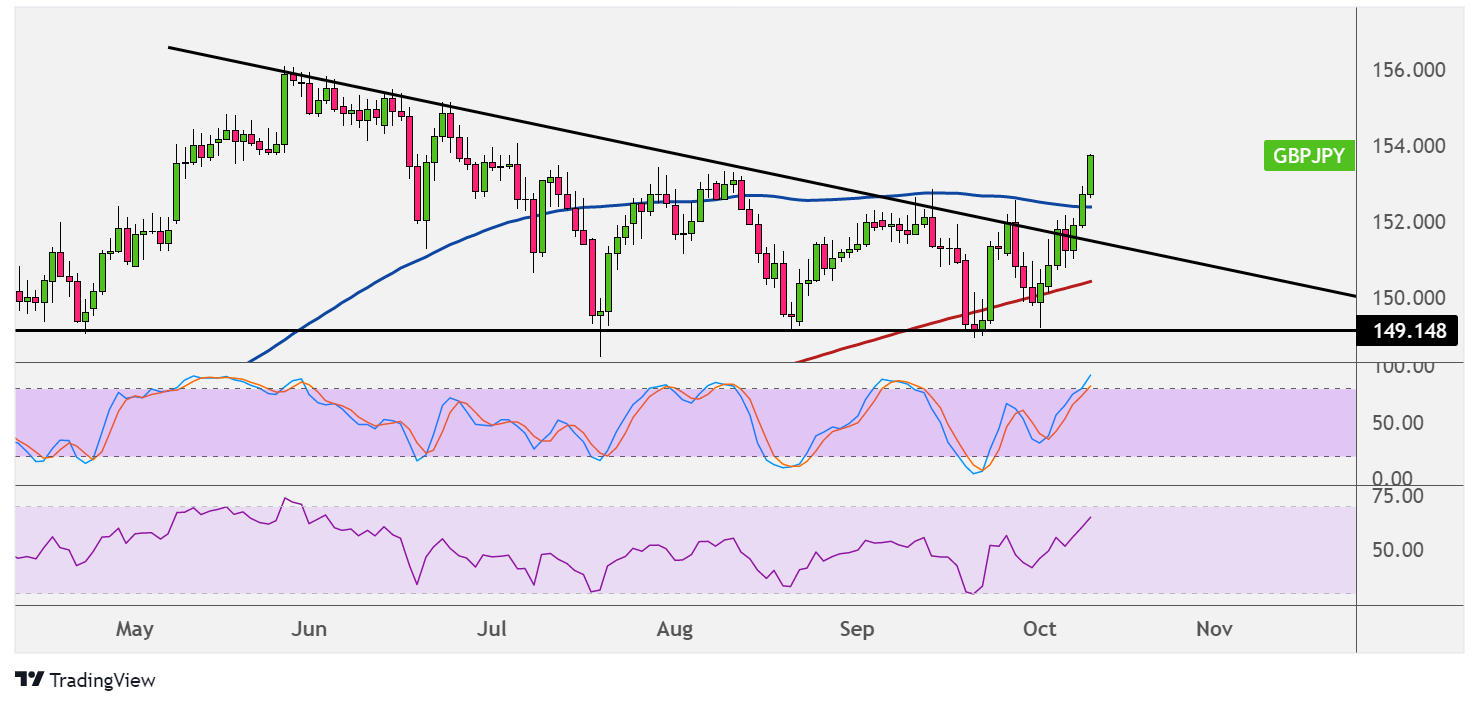
GBPJPY broke out of its descending triangle pattern on the daily time frame, confirming that a strong rally is in the works. Price could climb by the same height as the chart formation or nearly 700 pips.
The 100 SMA is still above the 200 SMA to indicate that the path of least resistance is to the upside or that the climb is more likely to gain traction than to reverse. The gap between the indicators is narrowing, but the pair broke above the 100 SMA dynamic inflection point to signal bullish pressure.

Stochastic is on the move up, so buyers could stay in control. However, the oscillator already reached the overbought zone to reflect exhaustion, so turning lower would suggest that sellers are returning. In that case, GBPJPY might simply pull back to the broken triangle top for a retest.
RSI has more room to climb before reflecting overbought conditions, so buyers might be able to sustain the rally from here.
There are no major reports from both economies this week, although it’s worth noting the glaring divergence between the monetary policies of the UK and Japan.
The former is awaiting an interest rate hike, following more votes to taper total asset purchases. Inflation has been very strong in the UK, and it looks like the rally in energy prices would keep overall pressures elevated enough to prompt tightening soon.
Meanwhile, the Japanese economy is reeling from higher energy costs weighing on export activity. This could keep a lid on growth, which is already struggling due to the pandemic, and convince the central bank to keep easing for much longer.
Also, risk appetite might come in play this week since earnings reports for the third quarter of the year could point to a strong rebound in growth.