
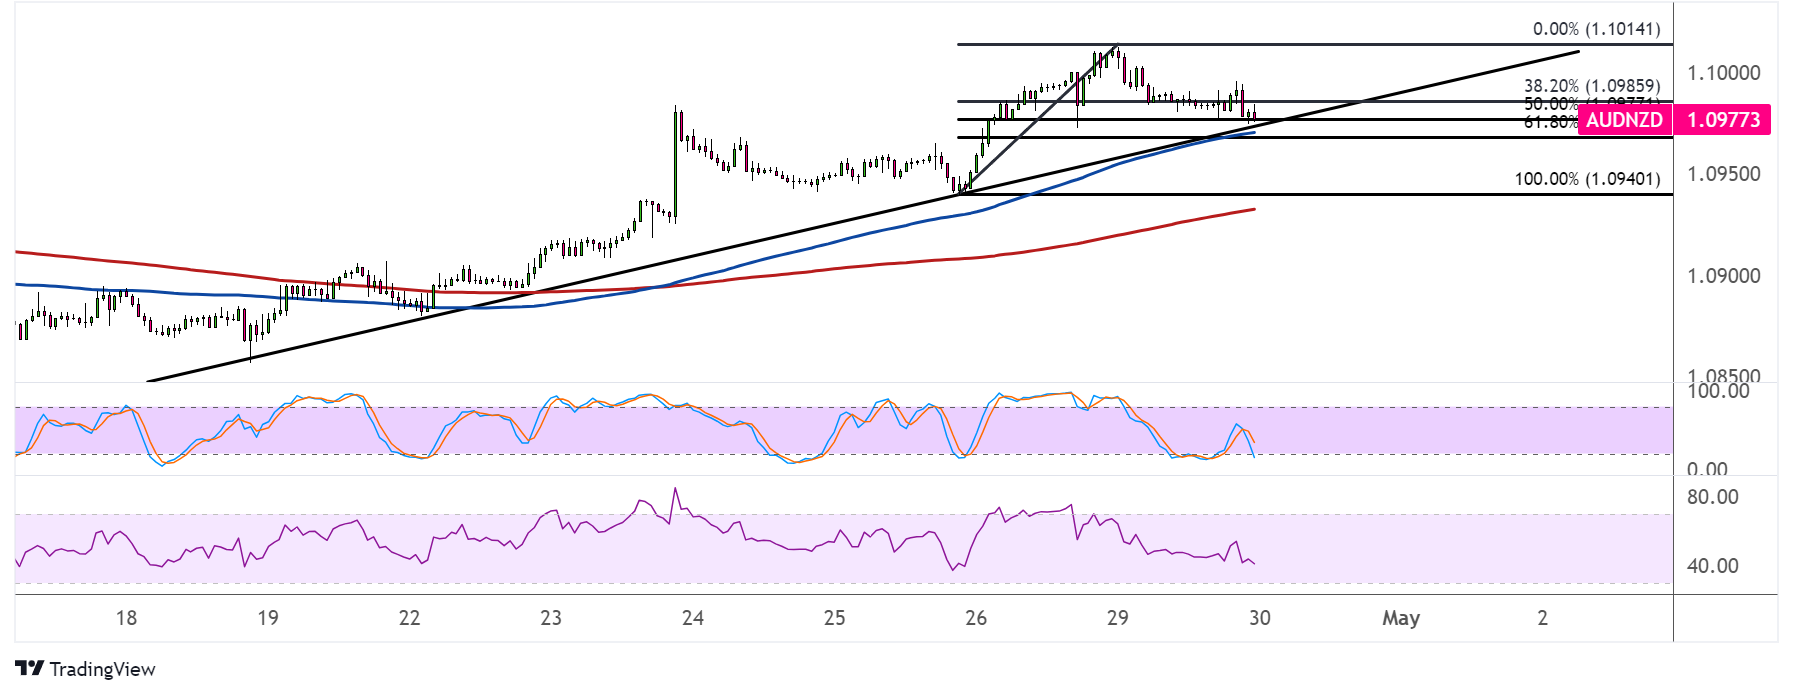
AUDNZD has formed higher lows connected by a rising trend line that’s been holding since mid-April. Price is testing this support zone spanned by the Fibonacci retracement levels.
To be specific, the trend line coincides with the 50% Fib at the 1.0975 area, which is also a former resistance zone. This is near the 100 SMA dynamic inflection point that adds to its strength as support.

On the subject of moving averages, the 100 SMA is above the 200 SMA to indicate that the path of least resistance is to the upside or that support is more likely to hold than to break. The gap between the indicators is widening to reflect strengthening bullish momentum.
Stochastic is still pointing down to reflect selling pressure, though, so a larger correction might be possible. RSI is also heading south, so price could follow suit while bears are in control. Turning higher would confirm that bullish momentum is returning and could take AUDNZD up to the swing high at 1.1014 or higher.
AUDNZD is being bogged down by downbeat Chinese PMI figures that reflected dips in manufacturing and services sector activity for April, but the Kiwi appears to be on shaky footing leading up to the NZ jobs report for Q1.
Weaker employment growth is eyed, with the net change expected at 0.3% versus the earlier 0.4% increase, and the jobless rate likely to climb from 4.0% to 4.3% for the period. Downbeat results could weigh on RBNZ hawkish bets and possibly convince the central bank to consider easing soon.
In addition, the labor cost index is slated to slow from 1.0% to 0.8% growth in Q1, also reflecting weaker consumer inflation pressures.
Stronger than expected data, on the other hand, could mean more upside for the Kiwi since this would reinforce the central bank’s upbeat outlook.