
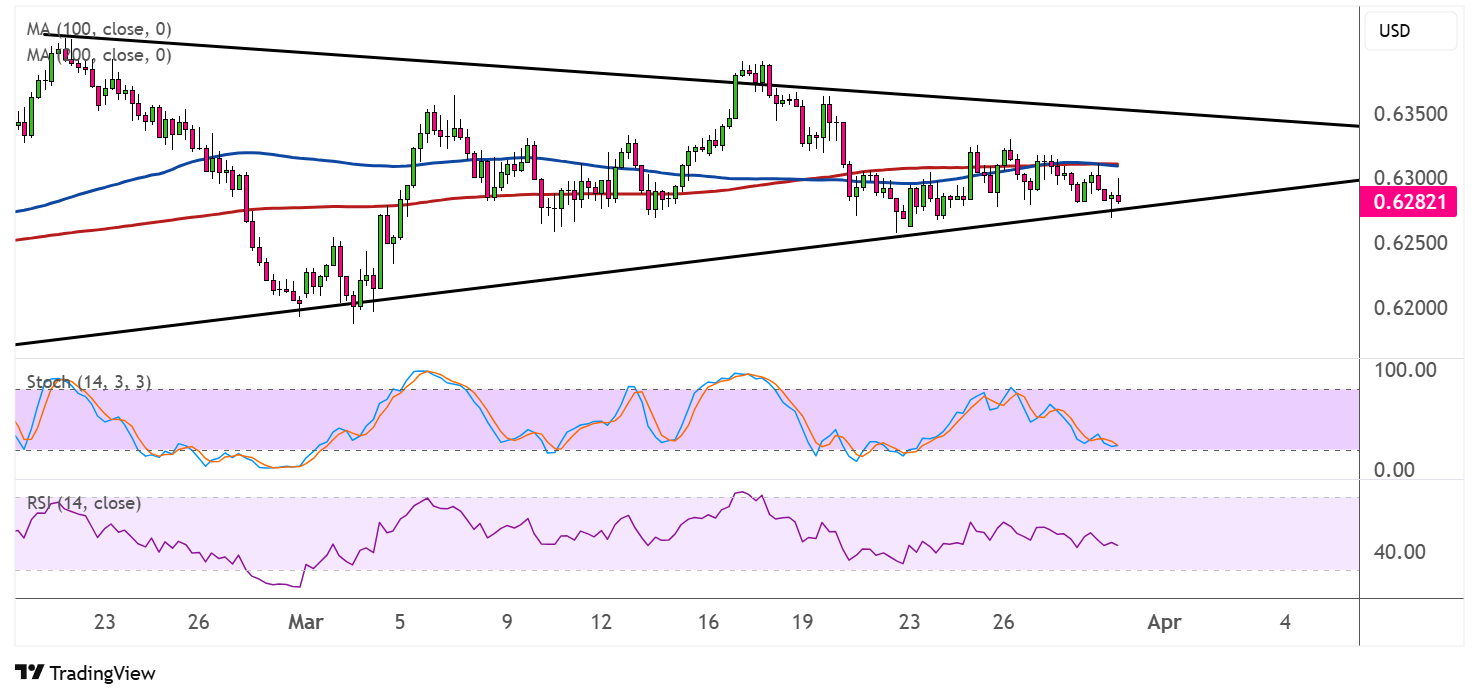
AUD/USD is currently trading within a symmetrical triangle pattern on the daily chart, indicating a period of consolidation as bulls and bears battle for control. The pair is hovering around the 0.6282 level, showing reluctance to make a decisive move in either direction.
The symmetrical triangle formation, with converging trendlines connecting the higher lows and lower highs since late February, suggests that a breakout could be imminent. Currently, price is finding support at the lower trendline around 0.6250, while facing resistance at the upper trendline near 0.6350.

The moving averages are painting a neutral to slightly bearish picture. Price is currently trading below the blue 100 SMA but above the red 200 SMA, creating a zone of mixed signals. The narrowing gap between these two moving averages suggests diminishing momentum in the previous trend.
The stochastic oscillator is declining from the middle range, indicating that bearish pressure might be building, though it has not yet reached oversold territory. This suggests there could be room for additional downside before a potential reversal.
Meanwhile, the RSI is hovering around the 40.00 level, showing bearish momentum but not yet in oversold conditions. This technical indicator confirms the stochastic’s reading that sellers may continue to have the upper hand in the near term.
AUDUSD could take cues from the upcoming RBA decision, as the Australian central bank is widely expected to keep interest rates on hold for the time being. Recall that the RBA signaled its intention to slow down its pace of easing, although weaker inflation and employment data for February could still convince policymakers to cut again.
In addition, trade risks stemming from another round of U.S. tariffs on China and retaliatory measures could wind up clouding the central bank’s outlook for exports and growth, possibly leading to a pre-emptive easing move aimed at shielding the Australian economy from more damage.