
Bitcoin ($BTC) price went through a couple of major crashes during August 2024, shocking investors concerning a rebound or further decline. Lookonchain, a prominent on-chain analytics platform, recently shared the analysis of 5 chief indicators for determining if the top crypto asset is reaching its peak or whether there still exists some room for an upsurge. The analytics firm took to social media to provide a detailed perspective in the respective analysis.
Rainbow Chart Indicates Bitcoin’s Current Market Position as Undervalued
As per Lookonchain, the rainbow chart is one of the 5 prominent indicators highlighting the market position of Bitcoin. The rainbow chart works as a long-term valuation instrument that utilizes a logarithmic expansion curve. It forecasts the likely future direction for Bitcoin’s price. The latest statistics of this indicator signify that the crypto token is still standing in the “cheap” area. This specifies that the crypto asset is presently undervalued in terms of its price.

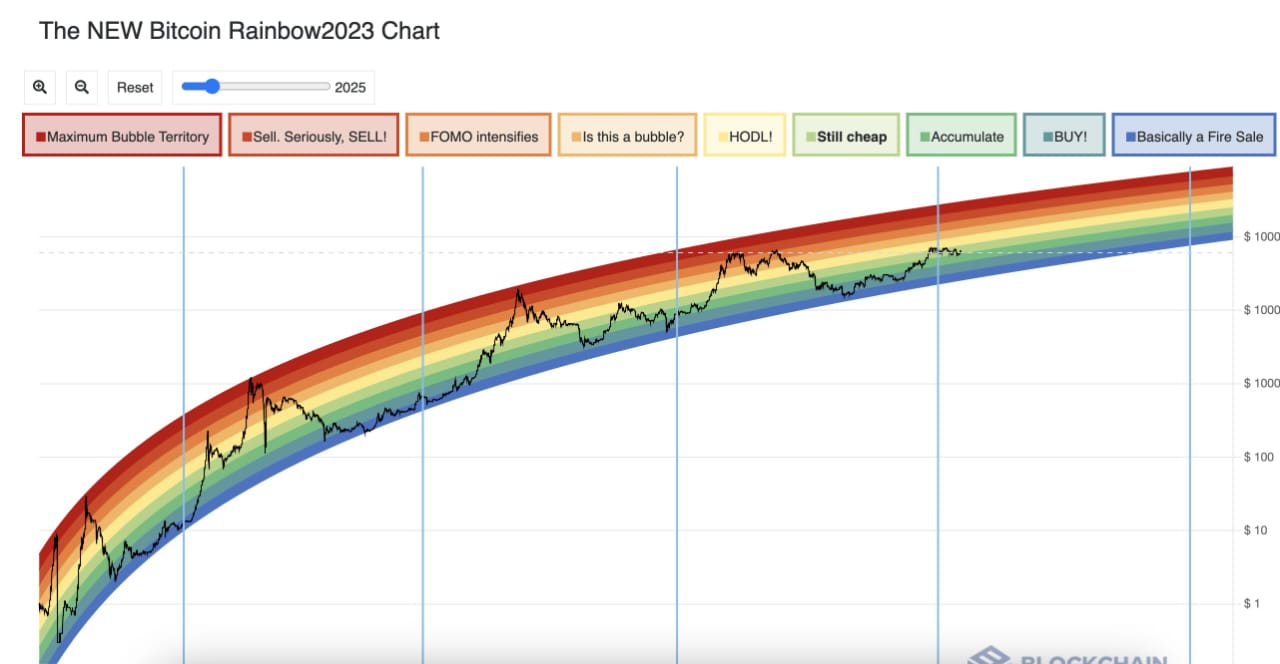
Long-term investors have historically been using this chart. This assists in estimating if Bitcoin is going through a selling, holding, or buying phase. $BTC stays in the rainbow chart’s lower bands, implying a potential for upward movements. Hence, the peak may not have been reached up till now.
Current RSI Indicates Bitcoin’s Room for Growth
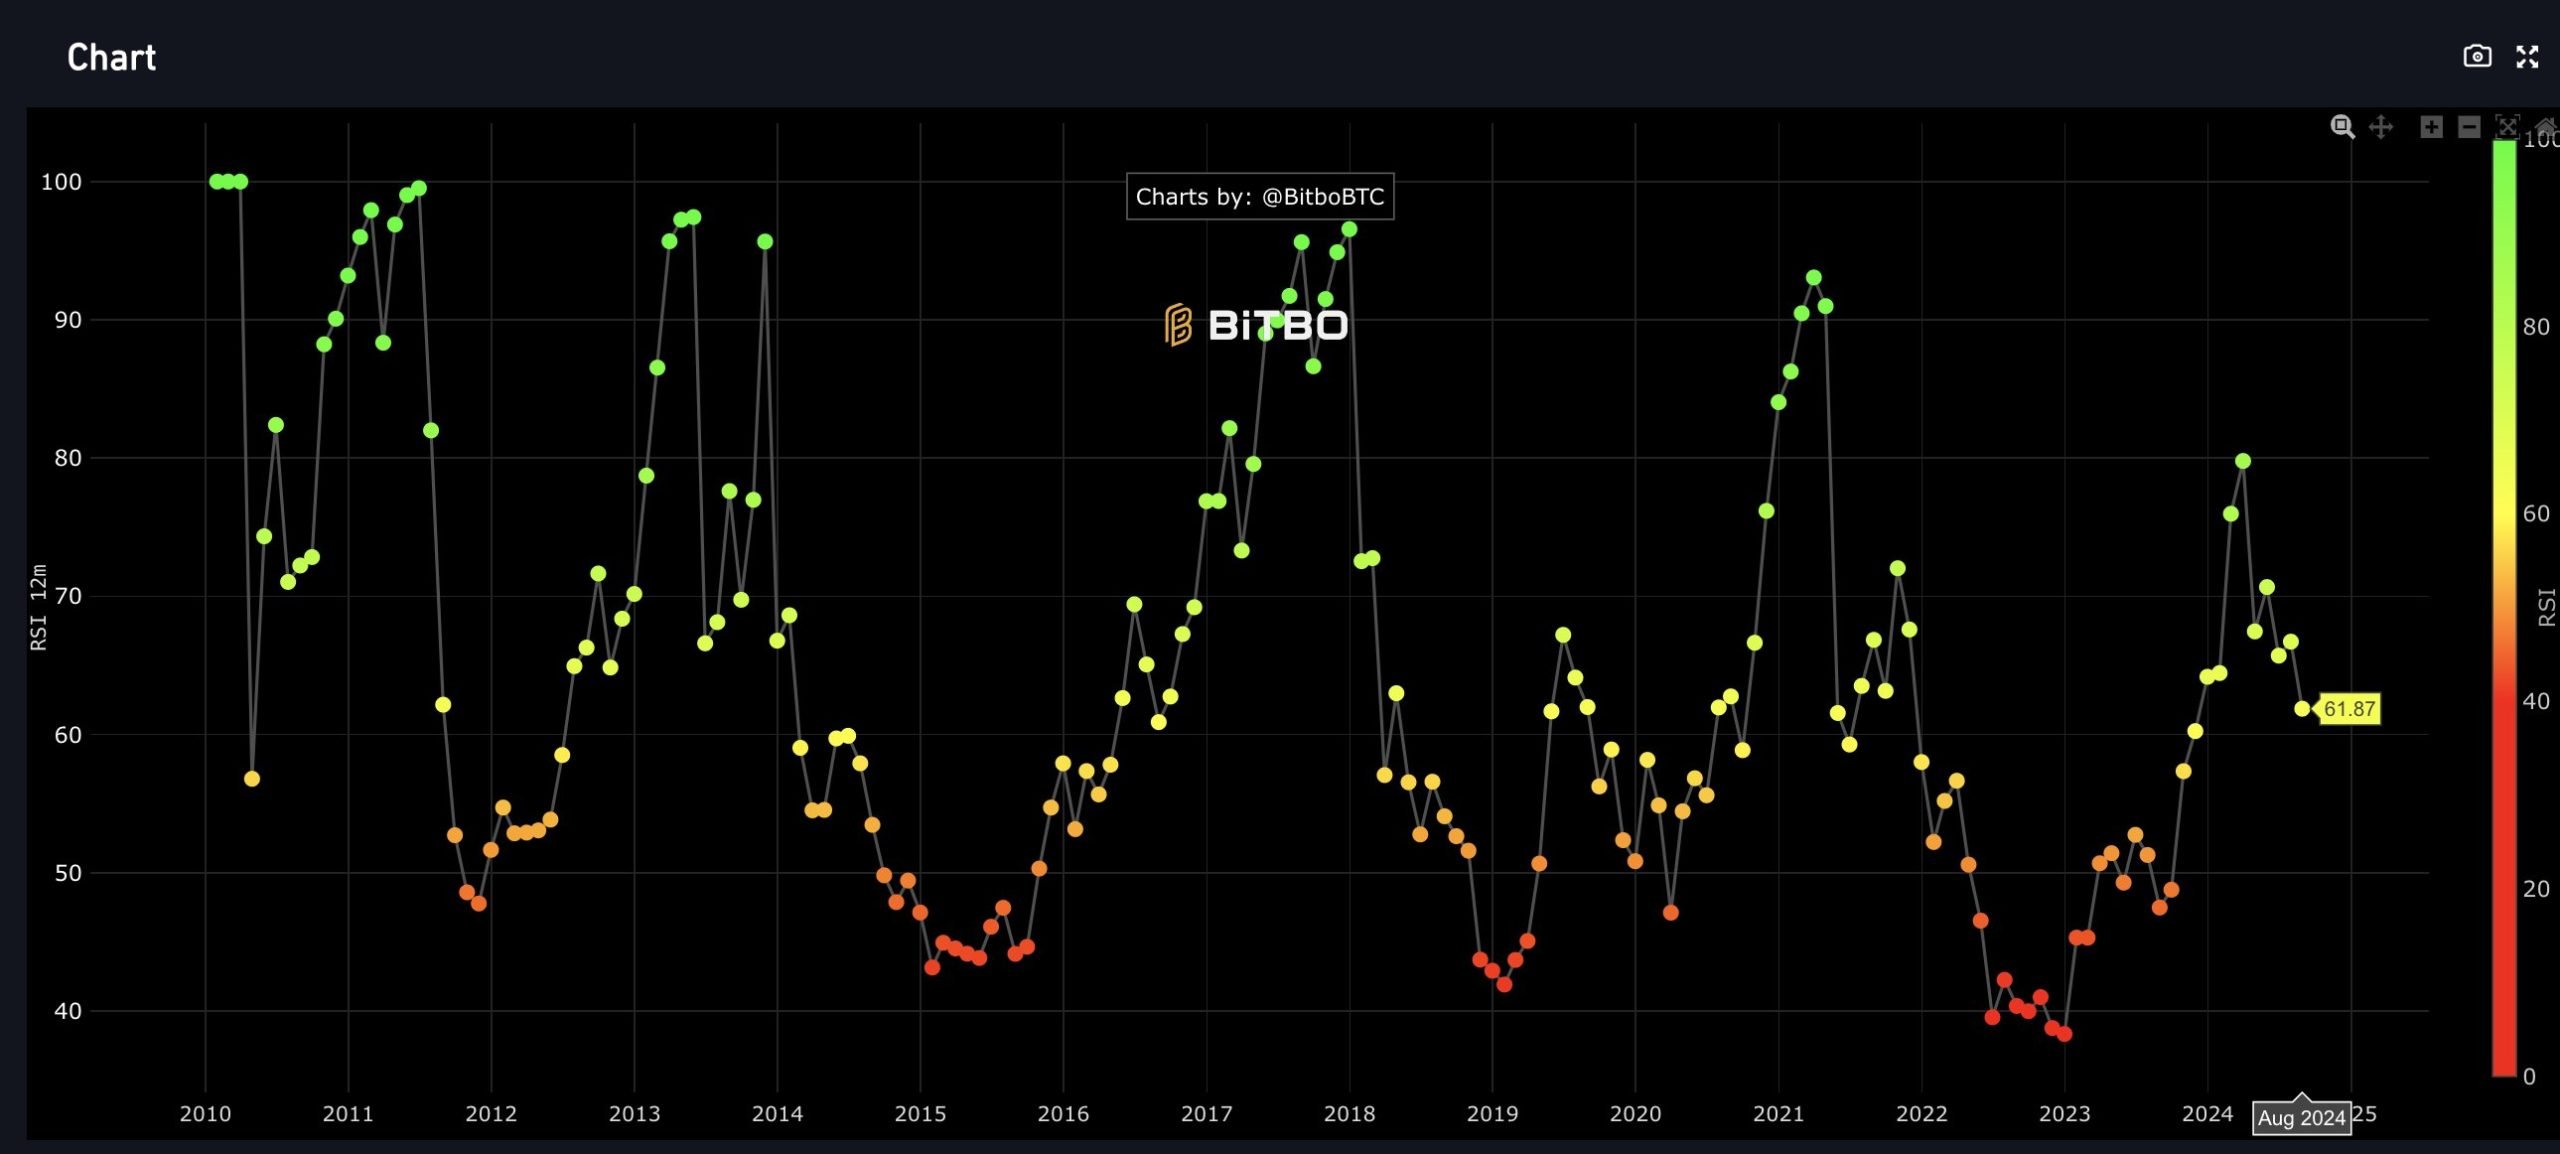
Another indicator in this respect is the relative strength index chart. RSI is a momentum indicator, measuring the price movements in line with the change and speed. If RSI’s mark is 70 or beyond, this suggests the overbought state of Bitcoin. In such a situation, Bitcoin may shortly go through a price slump. On the other hand, the 30 or lesser figure regarding the RSI points toward the oversold state of Bitcoin. Therefore, Bitcoin may shortly increase.
Trending Now: Altcoins to Bitcoin Correlation Analysis Indicates Likely Market Shift
At the moment Bitcoin’s RSI is almost 61.87. In line with this, $BTC is below its overbought threshold. According to this, the chief crypto has not touched its peak. Additionally, there is a possibility for price appreciation before a big correction.
200-Week Moving Average Heatmap Suggests It’s a Good Time to Accumulate Bitcoin
Moreover, the 200-week moving average heatmap is presently blue and signals that Bitcoin has not seen its peak. In this respect, it is a fine time to purchase an additional $BTC.

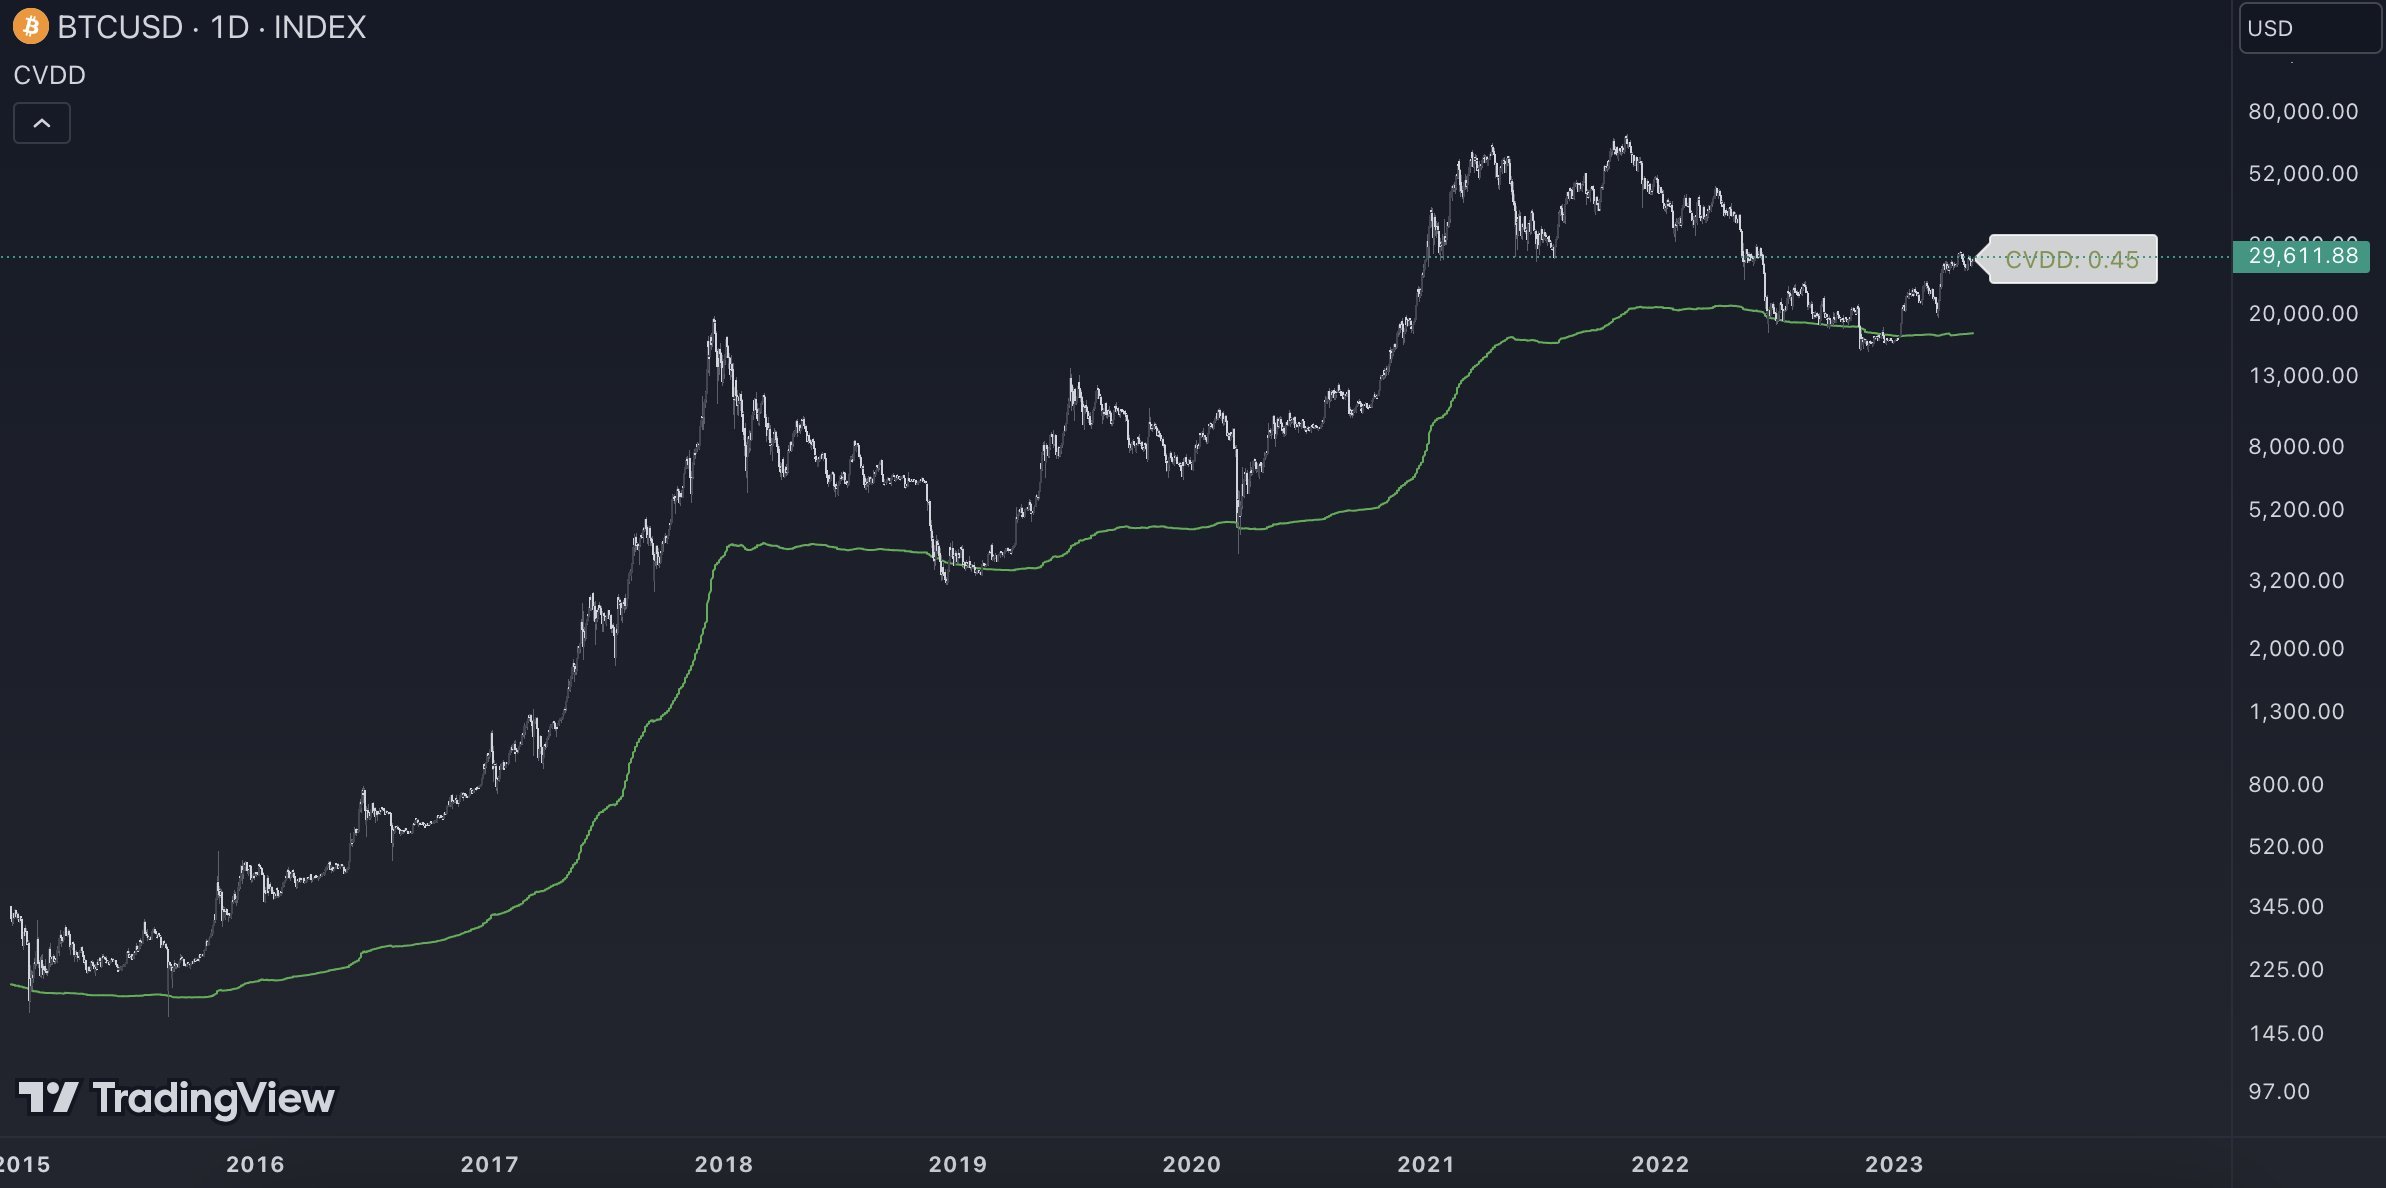
Furthermore, the cumulative value of coin days destroyed (CVDD) serves as another metric. It helps detect the undervalued position of Bitcoin. Currently, this chart also reinforces the idea that $BTC has not yet touched its top.
2-Year MA Multiplier Indicates Bitcoin Growth Potential
The 5th indicator is the 2-Year MA M]ultiplier compares the price of Bitcoin against a couple of chief moving averages. They take into account 2-year MA x 5 and 2-year MA. This indicator says the $BTC price stands between the green and red lines, again indicating room for further development.

In a nutshell, all the 5 indicators used by Lookonchain for this BTC analysis point out that it is still a good time to accumulate BTC. BTC is yet far from its bull cycle peak.