
On Friday, the Bitcoin price bounced from the session lows of about $62,770 to trade at about $63,852 after the latest data. BTC/USD trades within an ascending channel formation in the 60-minute chart.
The price of the pioneer cryptocurrency continues to trade a few levels above the 100-hour moving average line, despite making a late pullback. Friday’s pullback prevented it from advancing into the overbought levels of the 14-hour RSI.
Bitcoin Price Fundamentals Overview

From a fundamental perspective, BTC/USD trades during a relatively busy period in the US market. On Thursday, US existing home sales for June missed the expectation of 4.2 million, with 4.09 million, down from the previous month’s equivalent of 4.19 million.
On the other hand, the initial jobless claims for last week fell to 215k, down from 217k, beating the forecasted claim count of 218k. The continuing claims for the preceding four weeks increased to 1.814 million, up from 1.806 million.
Earlier in the week, the US consumer credit change for May missed the expectation of $17.1 billion, with a change of $-0.18 billion, down from $20.73 billion. Wholesale inventories for May came in better than expected, with a change of 0.1% versus a forecast of 0.3%.
The S&P Global Composite PMI for June missed the expectation of 52.2, with a reading of 51.9, down from the previous month’s equivalent of 52.2. On the other hand, the S&P Global Services PMI for the period fell short of the forecasted reading of 51.4, with a reading of 51.2, down from 51.3 in May.
Bitcoin Price Technical Analysis (the 60-min Chart)
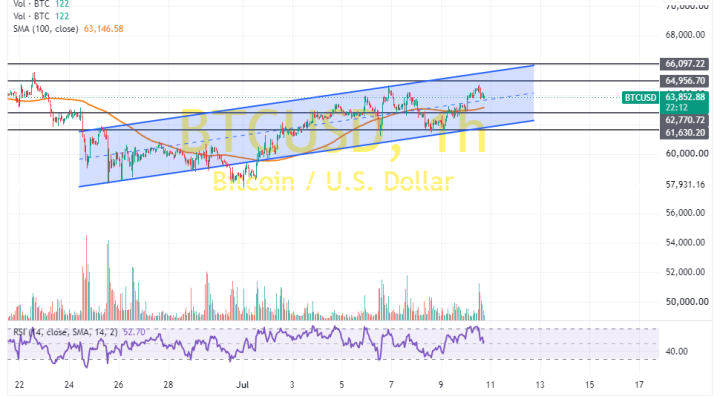
Technically, the Bitcoin price trades within an ascending channel formation on the 60-minute chart. However, the 14-hour RSI has recently pulled back to avoid rallying into overbought conditions.
Therefore, the bears will look to stretch the latest pullback towards $62,770 to lower to $61,630. On the other hand, the bulls will look to pounce on profits at about $64,956 or higher at $66,097.
Bitcoin Price Technical Analysis (the Daily Chart)
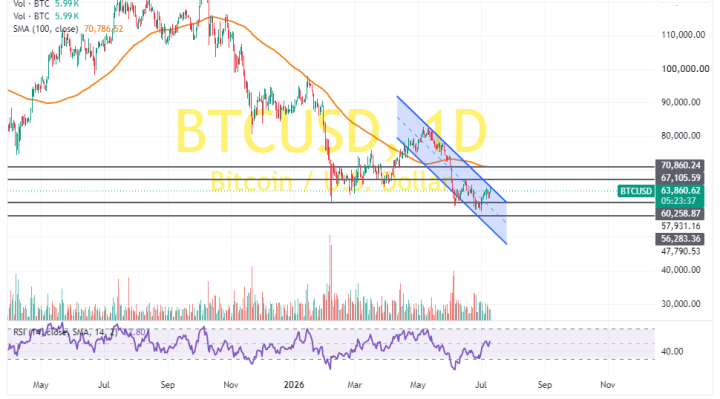
In the daily chart, the price of the pioneer cryptocurrency trades within a descending channel formation. However, the 14-day RSI has recently bounced back to recover from oversold conditions.
Therefore, the bulls will look to extend the current rebound towards $67,105 or higher to $70,860. On the other hand, the bears will look to pounce on pullbacks at about $60,258 or lower at $56,283.