
On Friday, the Bitcoin price extended the current rally to a new 8-week high of about $66,482 after the latest US data. The BTC/USD trades within an ascending channel formation in the 60-minute chart.
Bitcoin has now advanced to trade several levels above the 100-hour moving average line. As a result, the pioneer cryptocurrency entered the overbought levels of the 14-hour RSI.
Bitcoin Price Fundamental Overview

From a fundamental perspective, the BTC/USD trades at the back of a relatively busy period in the U.S. market. On Friday, the Michigan Consumer Sentiment Index for September exceeded expectations of 69.3 with a reading of 70.1, up from the previous month’s equivalent of 69. The UoM 5-year inflation expectations for the period remained unchanged at 3.1%, in line with expectations.
Elsewhere, personal income for August delivered a change of 0.2% (MoM), down from 0.3% in the preceding month, missing the forecast of 0.4%. Personal spending for the period also fell short of 0.3% with a change of 0.2%, down from 0.5% in July.
On the other hand, personal consumption expenditures – price index for August matched the (MoM) forecast of 0.1%, while the (YoY) equivalent fell short of 2.3% with a change of 2.2%. The core personal consumption expenditures – price index for the period failed to match the (MoM) expectation of 0.2% with a change of 0.1%, while the (YoY) equivalent was in line with the estimate of 2.7%.
Bitcoin Price Technical Analysis (the 60-min Chart)
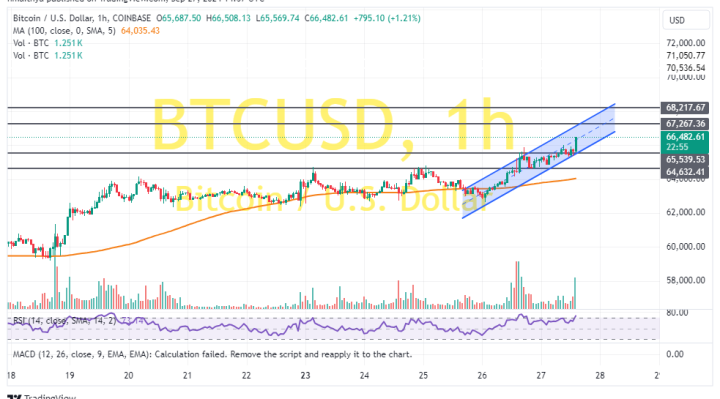
Technically, the Bitcoin price trades within an ascending channel formation in the 60-minute chart. The 14-hour RSI also supports a strong bullish bias as it enters overbought conditions of the indicator.
Therefore, the bulls will be looking to stretch the current rally towards $67,267 or higher to $68,217. On the other hand, the bears will look to pounce on potential pullbacks at about $65,539 or lower at $64,632.
Bitcoin Price Technical Analysis (the Daily Chart)
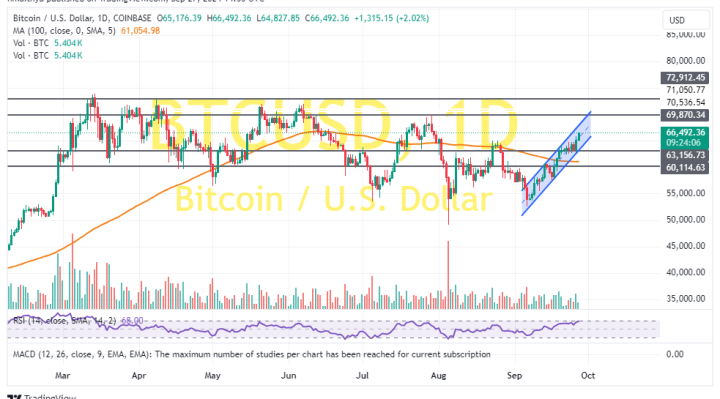
In the daily chart, the price of the pioneer cryptocurrency also trades within an ascending channel formation. The 14-day RSI supports a long-term bullish bias as it moves towards overbought conditions.
Therefore, the bulls will be targeting long-term profits at about $69,870 or higher at $72,912. On the other hand, the bears will look to pounce on pullbacks at about $63,156 or lower at $60,114.