
On Friday, the Bitcoin Price bounced from the key support at about $103,151 to trade at about $106,394. The BTC/USD currency pair trades within a sideways channel formation in the 60-minute chart.
The price of the pioneer cryptocurrency has now advanced to trade above the 100-hour moving average line. As a result, Bitcoin is on the verge of entering the overbought conditions of the 14-hour RSI.
Bitcoin Price Fundamentals Overview

From a fundamental perspective, the BTC/USD trades during a relatively busy period in the market. This week, the U.S. Securities and Exchange Commission established a Task Force to develop a clear regulatory framework for crypto assets.
The Agency also rescinded the controversial crypto accounting guidance SAB 121, introduced by the previous administration. Meanwhile, U.S. President Donald Trump has tasked the White House AI and Crypto Czar to liaise with experts to evaluate creating the U.S. digital asset reserve.
In the latest U.S. economic data, the preliminary S&P Global Manufacturing PMI for January outperformed the expectation of 49.6 with a reading of 50.1. The Services PMI for the period fell short of the forecasted reading of 56.5 with a reading of 52.8.
On the other hand, the Michigan Consumer Sentiment Index for January failed to match the forecast of 73.2 with a reading of 71.1, while the UoM 5-year inflation expectation for the month missed the forecast of 3.3% with a rate of 3.2%.
Bitcoin Price Technical Analysis (the 60-min Chart)
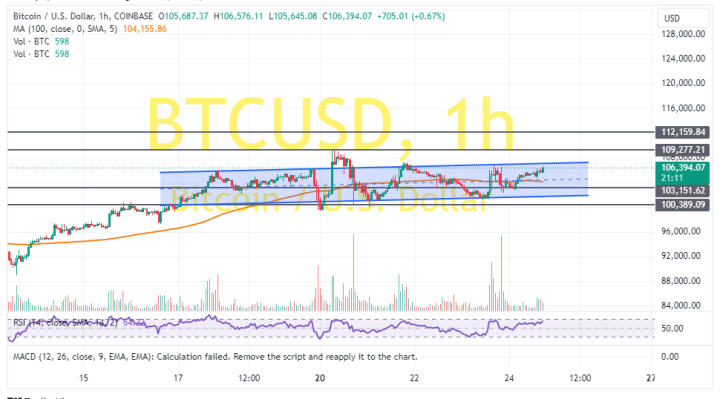
Technically, the Bitcoin price trades within a sideways channel formation in the 60-minute chart. The 14-hour RSI continues to trade closer to the overbought conditions, despite a recent pullback.
Therefore, the bulls will look to extend the current gains toward $109,777 or higher to $112,159. On the other hand, the bears will look to pounce on pullbacks at about $103,151 or lower at $100,389.
Bitcoin Price Technical Analysis (the Daily Chart)
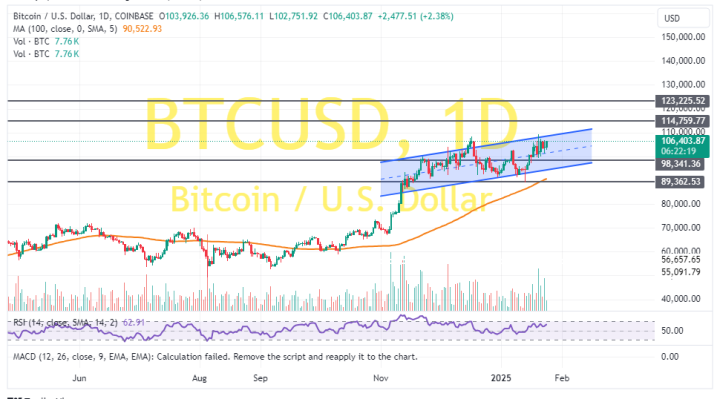
In the daily chart, the BTC/USD trades within an ascending channel formation. The 14-day RSI also supports a long-term bullish bias as it moves closer to the overbought conditions.
Therefore, the bulls will look to ride the current run of gains toward $114,759 or higher to $123,225. On the other hand, the bears will look to pounce on profits at about $98,341 or lower at $89,362.