
On Friday, the Bitcoin price pulled back from the current weekly highs of about $62,567 to trade at about $60,687. The BTC/USD trades within an ascending channel formation in the 60-minute chart.
The pioneer cryptocurrency trades a few levels above the 100-hour moving average line despite the pullback. Friday’s pullback pushed the BTC/USD back to the normal trading zone of the 14-hour RSI.
Bitcoin Price Fundamentals Overview

From a fundamental perspective, the BTC/USD trades during a relatively busy period in the US market. On Thursday, the US initial jobless claims for the week ending August 2 came in better than expected with a claim count of 233k versus a forecast of 240k. The continuing claims for the preceding week came in higher than expected with 1.875 million versus the expectation of 1.87 million.
Earlier in the week, the US ISM Services PMI for July outshone the forecast of 51 with a reading of 51.4. The ISM Services Prices Paid for the period also beat 55.8 with 57, while the ISM Services Employment Index exceeded 46.5 with a reading of 51.1. The S&P Global Services PMI for the period fell short of the forecasted reading of 55 with a reading of 54.3.
The bitcoin price continues to be affected by geopolitical forces but has recently bounced back to recover after a collapse driven by the German government’s BTC sell-off.
Bitcoin Price Technical Analysis (the 60-min Chart)
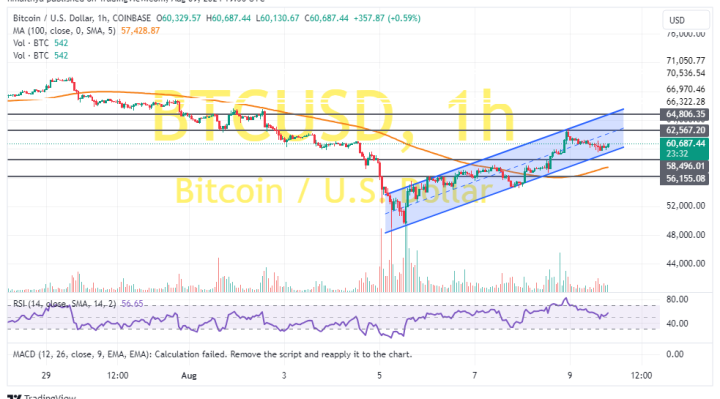
Technically, the BTC/USD trades within an ascending channel formation in the 60-minute chart. However, the 14-hour RSI has recently pulled back to return to the normal trading zone, indicating a potential change in the market sentiment.
Therefore, the bears will look to extend the current declines toward $48,496 or lower to $56,155. On the other hand, the bulls will look to pounce on profits at about $62,567 or higher at $64,806.
Bitcoin Price Technical Analysis (the Daily Chart)
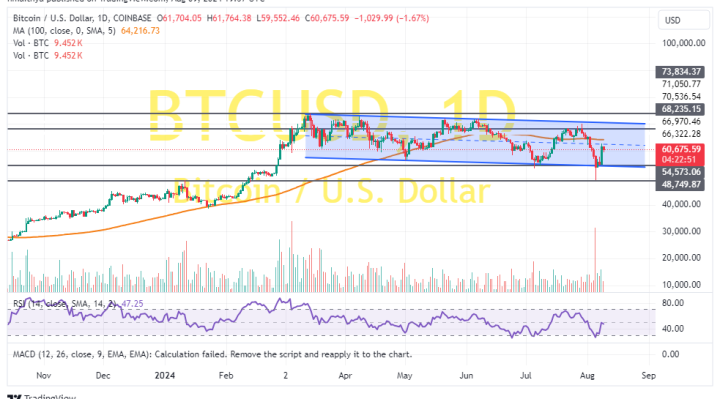
In the daily chart, the BTC/USD trades within a sideways channel formation. However, the 14-day RSI has recently bounced back to avoid descending into the oversold conditions of the indicator.
Therefore, the bulls will be looking to stretch the current rebound towards $68,235 or higher to $73,834. On the other hand, the bears will be targeting long-term profits at about $54,573 or lower at $48,749.