
On Friday, the Bitcoin price extended Thursday’s gains to trade at about $109,525 after the latest US economic data. The BTC/USD trades within an ascending channel formation in the 60-minute chart.
However, the price of the pioneer cryptocurrency continues to trade below the 100-hour moving average line, despite the rebound. Therefore, Bitcoin still has room left to run before reaching the overbought levels of the 14-hour RSI.
Bitcoin Price Fundamentals Overview

From a fundamental perspective, the BTC/USD trades during a relatively busy period in the U.S. market. The government shutdown has now been for four weeks as Congress remains in a stalemate over the budget approval for the compensation of Federal essential workers.
This continues to affect crypto prices overall and the US capital markets. However, recent talks between U.S. President Donald Trump and China’s Xi Jinping are providing hope of a potential trade deal that could thwart tariff wars.
In the latest U.S. economic data, pending home sales for September missed the expected (MoM) change of 1.7%, with a change of 0%. The Federal Reserve voted to lower the base interest rate by 25 basis points to 4%, down from 4.25%, in line with expectations.
Earlier in the housing price index for August outperformed the expected (MoM) change of 0.1%, with a change of 0.4%. On the other hand, the S&P/Case-Shiller Home Price Indices for the month fell short of 1.9%, with a change of 1.6%. The Richmond Fed Manufacturing Index for October came in better than expected with -4 versus a forecast of -14, up from -17/
Bitcoin Price Technical Analysis (the 60-min Chart)
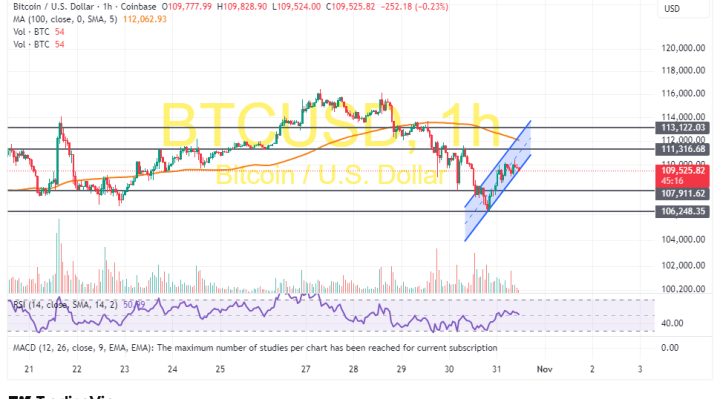
Technically, the Bitcoin price trades within an ascending channel formation in the 60-minute chart. However, the 14-hour RSI still has plenty of room left to run before reaching overbought conditions.
Therefore, the bulls will look to extend the current gains toward $11,316 or higher to $113,122. On the other hand, the bears will look to pounce on pullbacks at about $107,911 or lower at $106,248.
Bitcoin Price Technical Analysis (the Daily Chart)
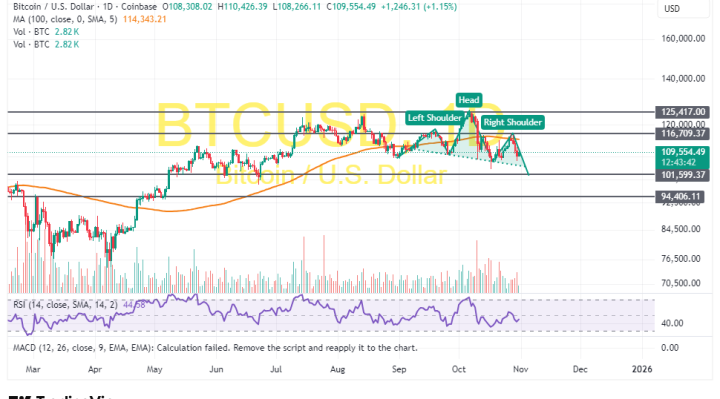
In the daily chart, the BTC/USD is about to complete a head-and-shoulders pattern formation. However, it still has room left to run before reaching oversold conditions.
Therefore, the bears will look to extend the current pullback towards $101,599 or lower to $94,406. On the other hand, the bulls will look to pounce on rebounds at about $116,709 or higher at $125,417.