
Crude oil on the path upward
Crude oil is in bullish sentiment since the price closed above monthly SMA 200 in January. However, the black gold moving sideways between 50% Fibonacci Retracement and the SMA 200 for three months. This month, it is the first time the bull could print a higher high and move past 2018 high.
Overall, the trend continues supported from the fundamental side where OPEC members and Russia committed to maintaining production cap this year. As long as the production cap sets, crude oil could continue its climb.

Click here to see Oil January analysis
New Month
Monthly chart

Crude oil path is upward on the monthly chart after the price move above 50% Fibonacci retracement level. The support to watch is the monthly SMA 200. We have seen crude oil holding up above the averages for three months, and it is in April a bounce happens. Currently, traders could look for the monthly close and determine if the bull could continue pushing the price upward.
Weekly chart
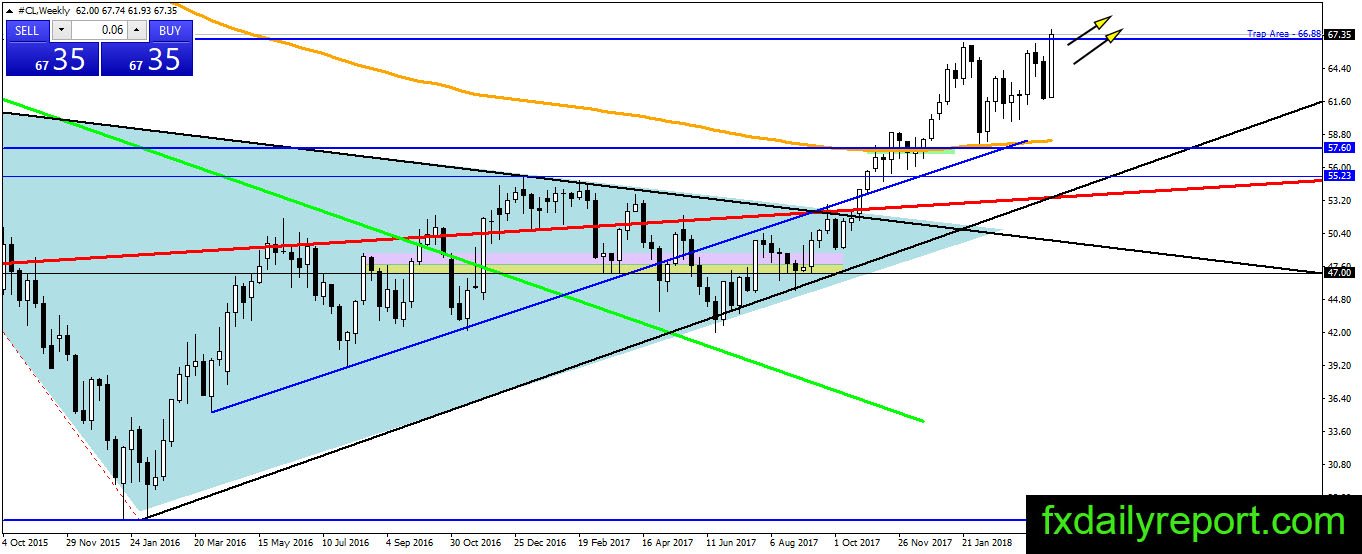
The weekly chart shows a strong bullish close above 2018 high and sentiment for further upside movement. Traders could look for long position near the breakout point $66.88 after a retest and bounce happen.
Daily chart

We have no suggestion yet for crude oil when the price is hitting the resistance. The price could continue further upside or reverse sharply and overturn the trend. The bull and the bear will fight fiercely above $66.88 until the end of the month. Expect some bouncing up and down near $66.88.
Trade plan
Bullish trade: The price is moving near resistance $66.88 and needs further confirmation of a breakout. Long position near $66.88 after a bullish pattern formed is suggested.
Bearish trade: The price could slip back below $66.88 resistance where it will provide short position opportunity. Conservative traders will wait until strong bearish pattern formed before placing position.