
Crude oil bull blasted resistance
Crude oil bull cleared two of the three resistance mentioned in the December analysis. Talking about the upward movement of crude oil, the average bear might be caught unprepared as the market extremely bearish on crude oil past this two years. Renowned investment bank Goldman Sach also caught red-handed calling for the decline in crude oil.
Crude oil bullish movement is in a full throttle mode, and it could continue this year as OPEC recommit the production cut policy.

Click here to see Oil December analysis
New Month
Monthly chart
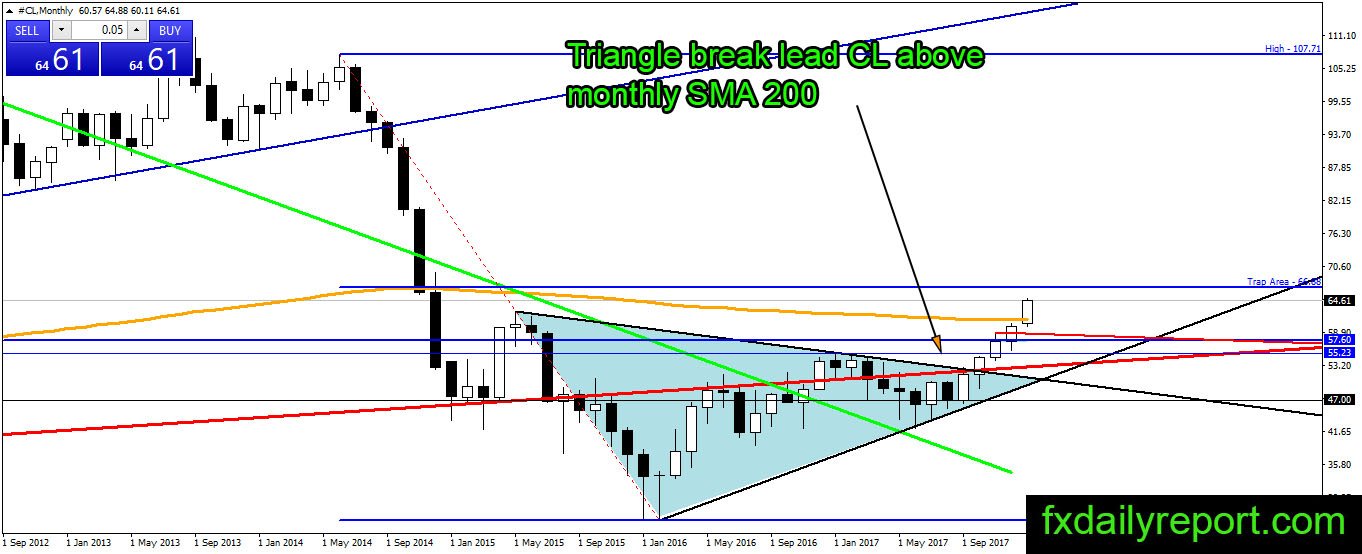
Crude oil on the monthly chart has surpassed the daily SMA 200 and 2015 high at $62.57 without any weakness. The price entered the fifth month of bullish close and might break the nearest resistance. The nearest resistance to watch is the 50% Fibonacci retracement. Is it the time to take a short position? Traders might want to stick to a long position, and the best location to look for long is the daily SMA 200.
Weekly chart
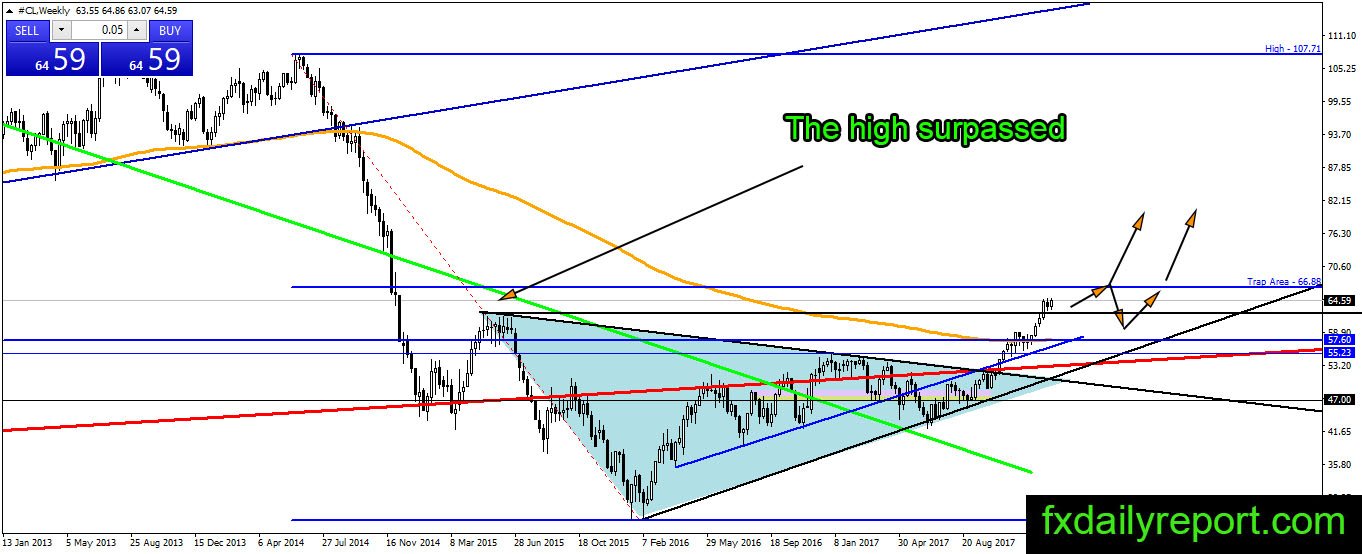
There is nothing to do yet on crude oil prices. Traders could continue to watch the appreciation in price which will test 50% Fibonacci retracement level soon. Long position from the $62.57 broken resistance might be one of the best decision to take.
Daily chart
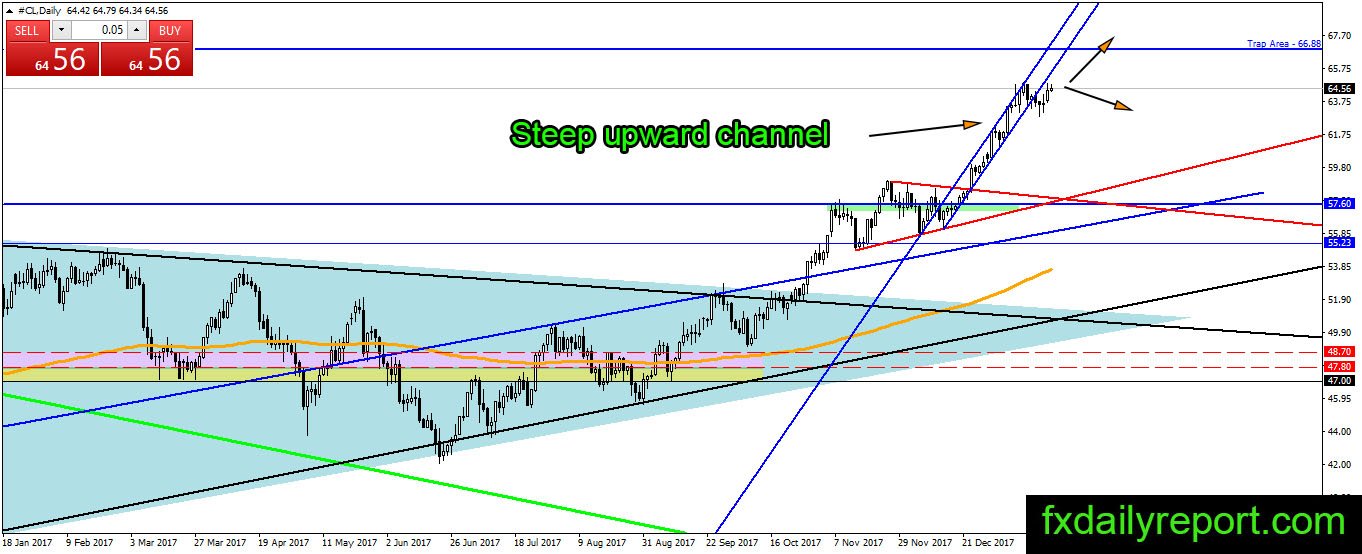
We could assume the price of crude oil losing part of its bullish momentum as the price move out of its short-term channel. Despite the move outside of the channel, bullish momentum stays strong, and it is better for traders to stay sideline.
Trade plan
Bullish trade: A correction is needed before traders could place long position. The price of crude oil has entered initial long-term bullish trend and could continue further upside. $62.57 and monthly SMA 200 are the levels to watch.
Bearish trade: Traders might want to stay sideline, for now, no strong bearish setup formed yet.