
Crude oil more gain
The bull extended crude oil gains to the third month and its continue to push the price higher this month. We could see $60.00 round number passed by the bull. This month bullish pressure comes after U.S-China trade talk progress shows a positive development. It is possible both countries will reach an agreement in four weeks.
On the production side, OPEC reported a drop of 570,000 bpd on oil production to 30.23 million bpd in March. The number is the lowest since four years ago. If the trend of production continues stable then we could expect crude oil price to continue to move higher.

Click here to see Oil March analysis
New Month
Monthly chart
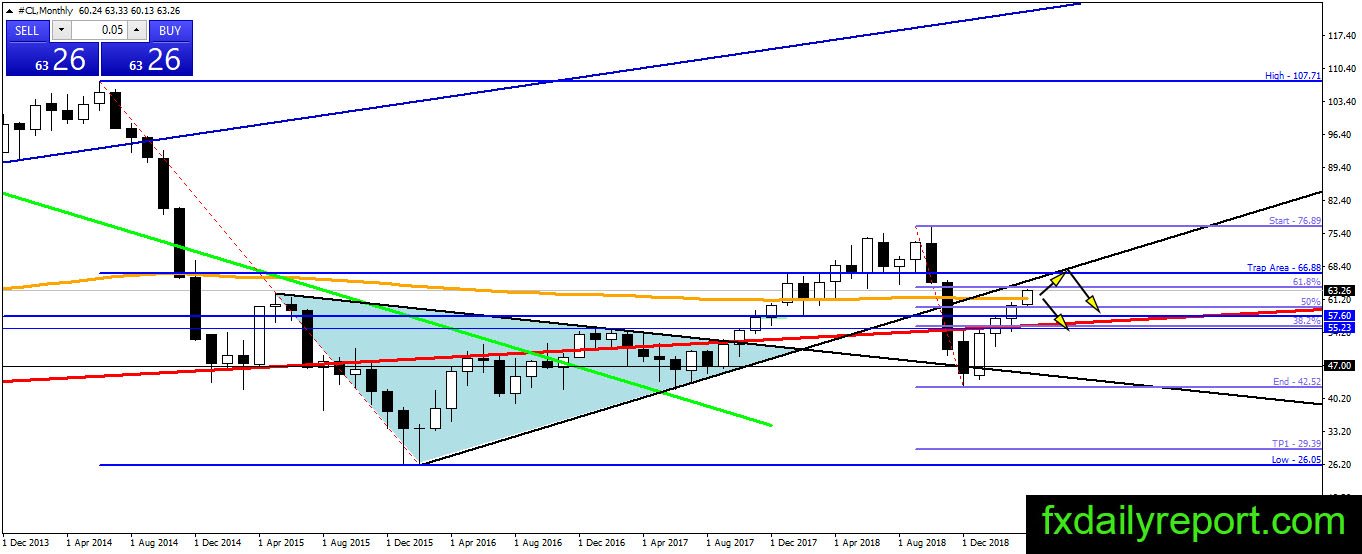

Crude oil on the monthly chart has surpassed the MSMA 200 and has not shown any sign of slowing down. The price might continue higher and test the trendline and $66.88 which is the 50% Fibonacci Retracement level. As long as the price close higher then there is no reason to take short positions.
Weekly chart
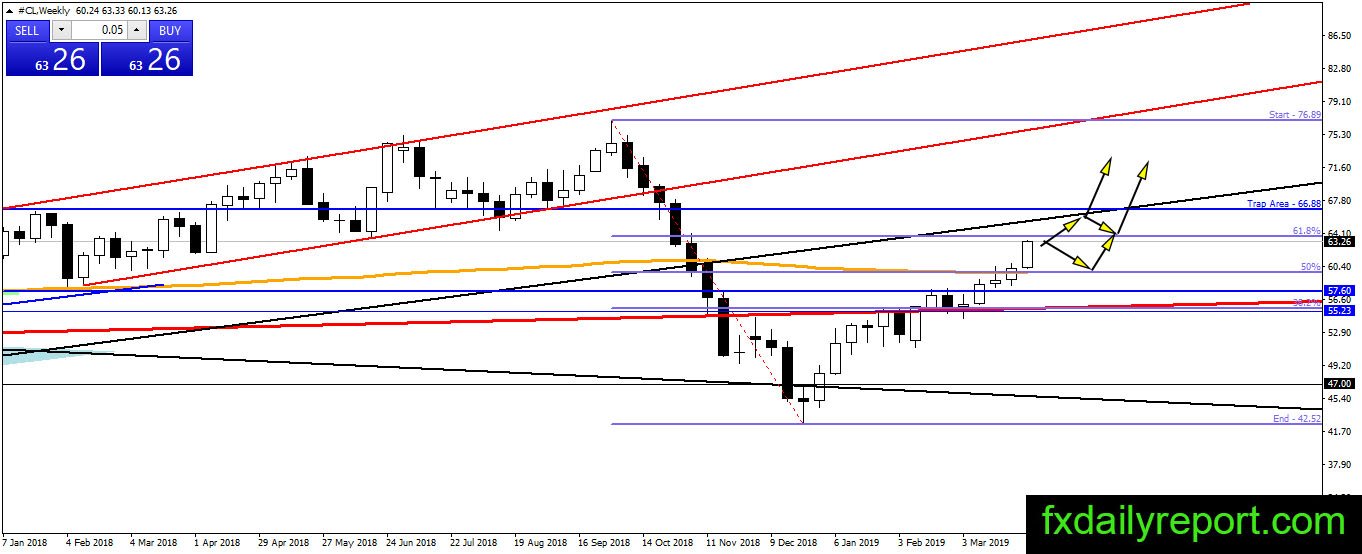
The trend changes to strong bullish after crude oil climb above WSMA 200 and closes above it. Similar to the monthly chart situation, there is no reason to take short positions yet. Crude oil could climb further higher and test the trendline and $66.88 level before turning lower.
Daily chart
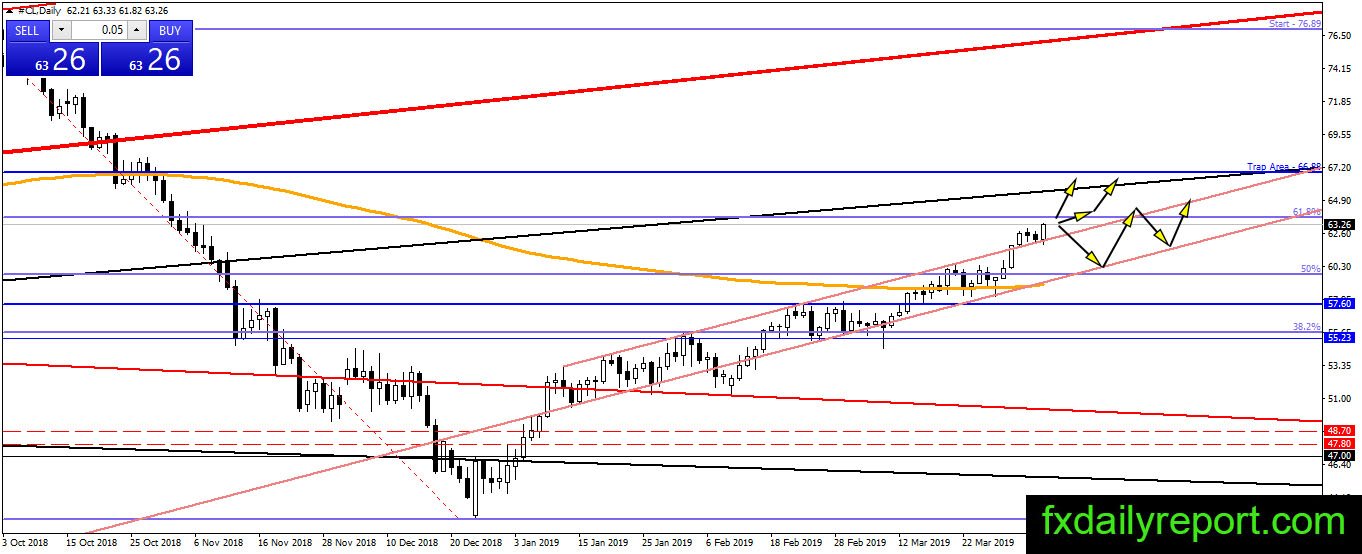
No Strong bearish reaction from the daily SMA 200 in the previous test and crude oil manage to climb above it. There is long position opportunity when the price fell back to test SMA 200 before it launched to the current level. At the current time, crude oil bullish momentum broke out of the bullish channel shown on the chart. No short position suggested yet and the bull might maintain the price above channel bottom if it turns lower.
Trade plan
Bullish trade: Wait for bearish correction before placing long positions. The bottom of the channel on the daily chart might be one of the ideal position traders could consider.
Bearish trade: 50% Fibonacci retracement at $66.88 is the one to watch.