
Crude oil looking to add gain
The price of crude oil extends gain in February after the bounce in January. A positive development on U.S-China trade war put the market at ease. Initially, President Trump scheduled to meet China’s Xi Jinping this month. However, the schedule pushed back to April. If both countries could reach a deal then we might see further upside in crude oil.
On another side, a slowdown in growth experienced across the global market. Japan predict their economy will grow slower this year and an inflation target of 2% will not be reached this year. Recent data from China also show a sharp decline in export post-trade war. Worries might mount and push crude oil prices down if the situation does not improve in the coming month.

Click here to see Oil February analysis
New Month
Monthly chart


$57.60 resistance has been broken on the monthly chart. Crude oil currently on track higher to test 50% correction level around $60.00. It will be a hard resistance to break as there is a monthly SMA 200 present above the level. However, if crude oil could breakout above both levels then we could expect the long-term trend will turn bullish.
Weekly chart
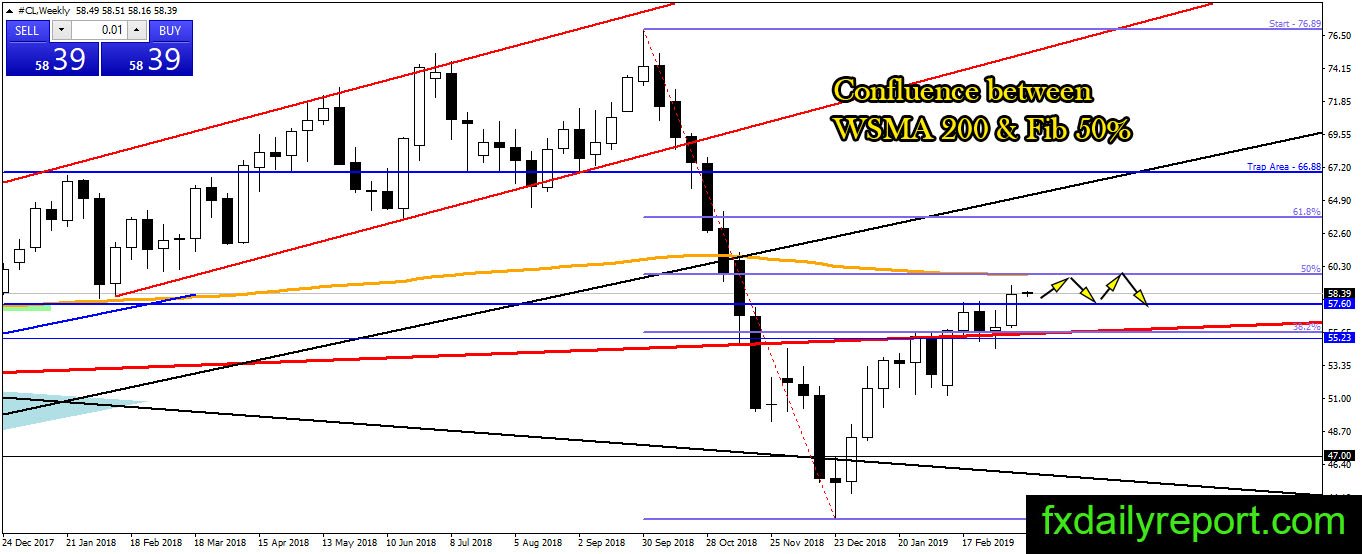
Zooming in the weekly chart, crude oil upward movement soon will hit the confluence of weekly SMA 200 and 50% Fibonacci retracement. We have a confluence of weekly and monthly levels which mean there will be a strong reaction from the levels. Will crude oil breakout above the level or rejected from it?
Daily chart

When we take a closer look at crude oil daily chart, we could say it is the best time to wait and see on crude oil. The price is hitting daily SMA 200 and no sign of breakout yet. If the pair could break above daily SMA 200 there will be a stronger cluster of resistance on the higher time-frame. Traders must not place long positions in the current situation and stick to short when there is a strong bearish reaction.
Trade plan
Bullish trade: Wait and see until resistances on the weekly and monthly chart broken.
Bearish trade: Short positions from daily SMA 200, WSMA 200 and monthly SMA 200 also 50% Fibonacci Retracement is the options trader could consider.