
Crude oil supply problem
The trend of crude oil prices extremely bearish as the U.S oil production boom continues. OPEC might be able to curb supply for a while and currently the price moving upward. However, problems persist and the market expects this year economic growth will be slower.
The trade war between U.S-China is the main cause of slower economic growth. Both parties currently negotiating with each other to reach a deal. If a deal reached then the market will turn optimistic and crude oil has a chance to rally. At the current time, there is no clue yet on crude oil next direction.

Click here to see Oil December analysis
New Month
Monthly chart


Crude oil extends its downtrend in December and dropped below $50.00 also the red trendline. Fortunately, the downward pressure recedes and crude oil close as bullish candlestick in January. The close above December opening level and has the opportunity to continue this month. Currently, the price is moving above January high and targeting $57.60 resistance.
If the resistance is broken then we could expect crude oil extend its gain toward monthly SMA 200.
Weekly chart

Crude oil decline has stopped and the price is in bullish correction. The correction has reached 38.2% and there is a bearish reaction at the first test. Currently, the bull making another attempt to break the resistance. If breakout happened then crude oil expected to continue higher, test 50% and weekly SMA 200.
Daily chart
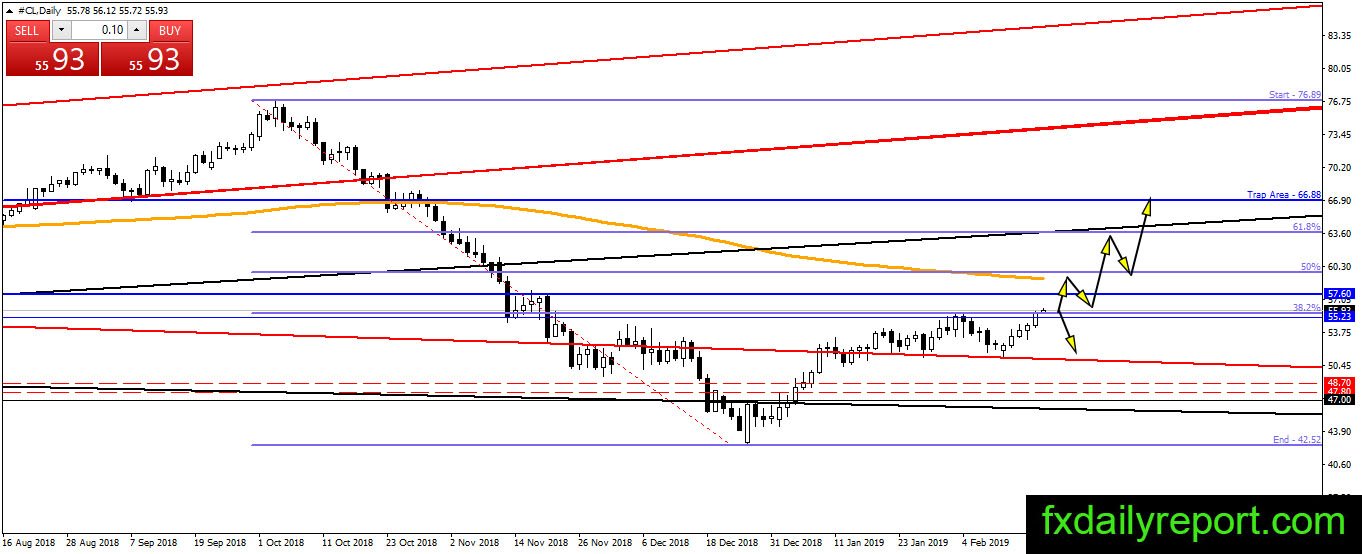
On the daily chart, crude oil building a bullish momentum and currently up for fifth days. The price expected to continue toward $57.60 resistance and the daily SMA 200. There is no bearish indication yet and traders might want to wait for the reaction near both resistances before placing any positions.
Trade plan
Bullish trade: No bullish position suggested until the price hit $57.60 or daily SMA 200. When the resistances reached and there is a correction, traders could watch $55.00 – $56.00 for a bounce.
Bearish trade: The level around $57.60 or the weekly SMA 200 is what traders will watch. (Same outlook)