
Crude oil beaten on the resurgence of supply problem
The bullish market in crude oil end abruptly in October as the price both print fresh yearly high and closed below previous month low. The price then drops sharply in November, fell from $64.88 to close at $50.61. It has fallen from $76.89 to $50.61 or around 30% from the top.
Many would question why the sudden drop happened and it could be attributed to the assassination of Kashogi and rise in crude oil production by Saudi and Russia. On 6th December, OPEC will meet with allies to determine oil production output and policies. Expect some movement in crude oil when the meeting takes place.

Click here to see Oil October analysis
New Month
Monthly chart

On the chart, we could see a 12-month gains erased by merely two months drop. However, if we look at the chart closely, the event happened near the 50% Fibonacci Retracement. It is a legit selling and has a chance to grow into a full-scale bearish trend. In December, the trend will be determined after the OPEC meeting. We expect the bear will continue in control and bring the price further downside.
Weekly chart
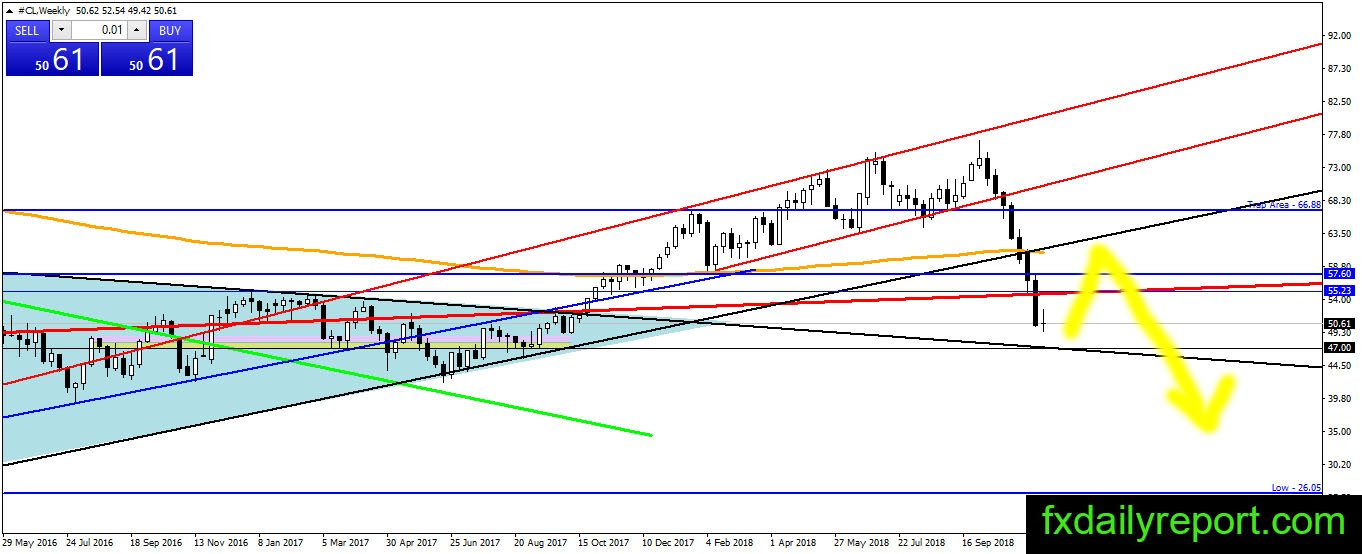
A 7-week decline in crude oil prices might be overdue for a correction. If correction happens then traders could expect crude oil will reach the weekly SMA 200 before continuing further downside. Short position near the averages is the best options traders could watch.
Daily chart
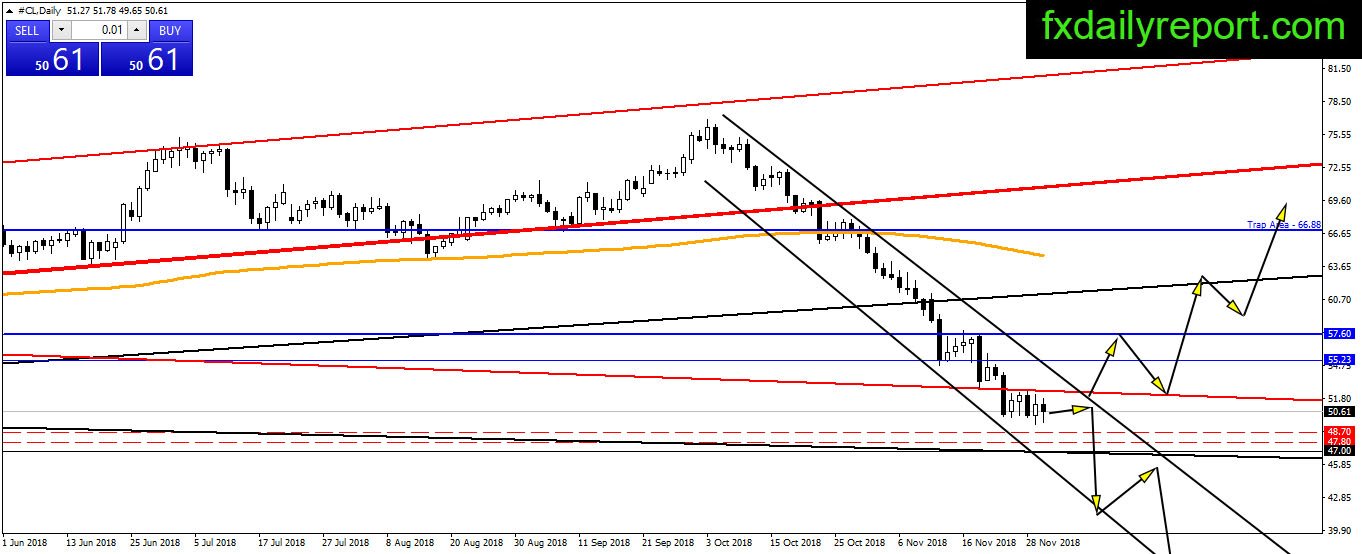
No bullish sign on the crude oil daily chart and the price continue moving down inside the bearish channel. However, the price seems to make a pause near $50.00 level. Without any breakout above the channel, we think crude oil will continue its downward movement.
Trade plan
Bullish trade: $50.00 is the level to watch for a possible bounce. However, we do not expect the bounce will turn into a strong bullish leg. It is safer to stick to the short side and taking a short position when correction happen.
Bearish trade: The level around $57.60 or the weekly SMA 200 is what traders will watch.