
Crude oil bearish continuation
Trader wars between U.S and China intensifying and both parties might not reach any deal soon. The trade war diminished growth forecast thus will impact crude oil demand in the future. In the previous week, President announced 5% tariff toward Mexico imports and will increase gradually depending on how Mexico handles migrant issue entering the U.S.
The outlook of crude oil expected to remain subdued for the near future.

Click here to see Oil May analysis
New Month
Monthly chart

A major reversal in crude oil prices happened in the previous month. The price fell from the 61.8% Fibonacci Retracement level and below daily SMA 200. It formed a bearish marubozu candlestick which means the bearish pressure might continue this month. If the bearish pressure continues then we could expect the price to hit $50.00 or $47.00 soon.
Weekly chart
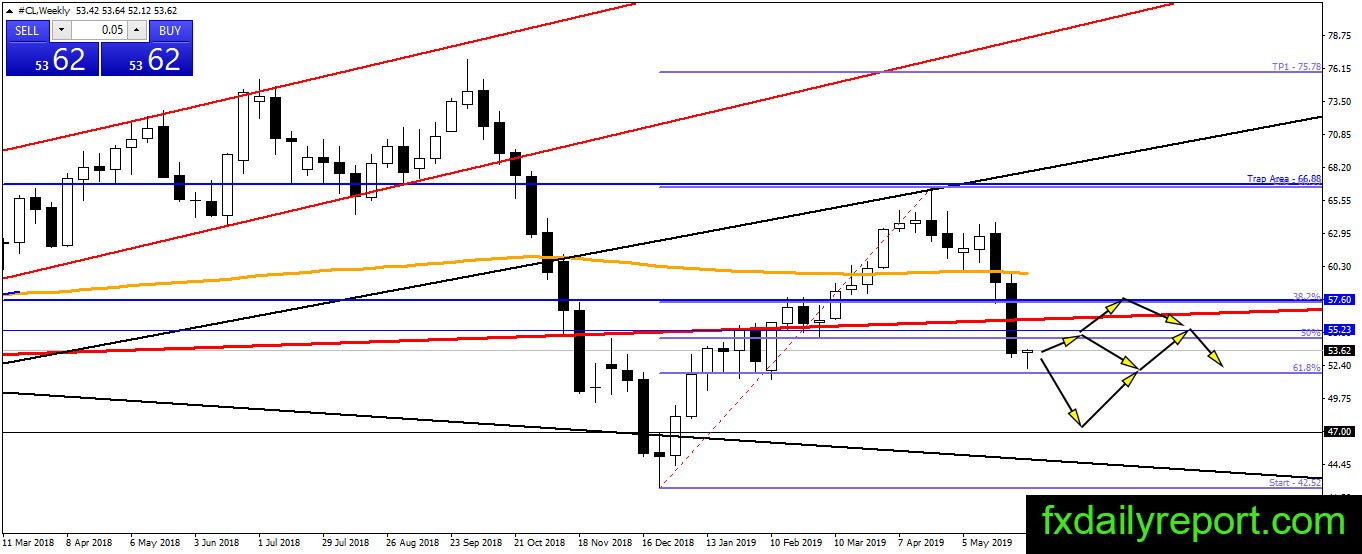
Rejection from the trendline and bearish engulfing pattern is the initial sign for crude oil to start the bearish leg. Initially, the price hit Weekly SMA 200 and attempted to bounce. However, the bear gained traction and the averages broken downside. Since the breakout, the price fell sharply and closed below the 50% Fibonacci Retracement level.
This week, the bearish movement continues and the price bounce from the level near 61.8% Fibonacci Retracement level. The bounce is not final and the price could reverse downside before the end of the week. If the bounce continues upward then traders could look for short positions near the red trendline.
Daily chart

The overall trend of crude oil on the daily chart is bearish and no change to it yet. The price bounce from the bottom of the pink channel today or near the support 61.8% Fibonacci Retracement. Long positions are not suggested as the overall trend is bearish. It is better to wait for the price to hit 50% Fibonacci Retracement or $57.60 and enter short positions on weakness.
Trade plan
Bullish trade: Current bearish pressure is extremely strong and the nearest support is the 61.8% Fibonacci Retracement on the daily chart. As long as the price could stay above the level then there is a chance for the bull to reverse current bearish pressure.
Bearish trade: Short near $57.60 and 50% Fibonacci Retracement level on the daily chart are options traders could take.