
Crude oil enter bearish correction
Nothing could stop the bullish trend in crude oil yet after the price makes another higher close in April. The overall outlook is bullish and supported from the fundamental side. On the latest news, U.S has stopped waiver to import Iranian oil and will give sanctions to the country who continue import the oil. The situation expected to change the supply market.
On trade war, U.S-China currently undergo heightened tension as the U.S ready to implement sanction by this Friday, raising the tax from 10% to 25% for $200b China imported goods. Moreover, $325b products inline for the 25% tariff. There is trade talk under progress since Wednesday, the result of the talk will influence crude oil prices.

Fallout in the trade talks should incite fear in the market and might pull crude oil prices lower.
Click here to see Oil April analysis
New Month
Monthly chart

On the monthly chart, crude oil has climbed for the fourth month and closed above monthly SMA 200. The price retraced 61.8% of previous bearish swing and now testing the averages. The bull trying to maintain the position above the averages this month. A close above SMA 200 could trigger further bullish leg above April high.
Weekly chart
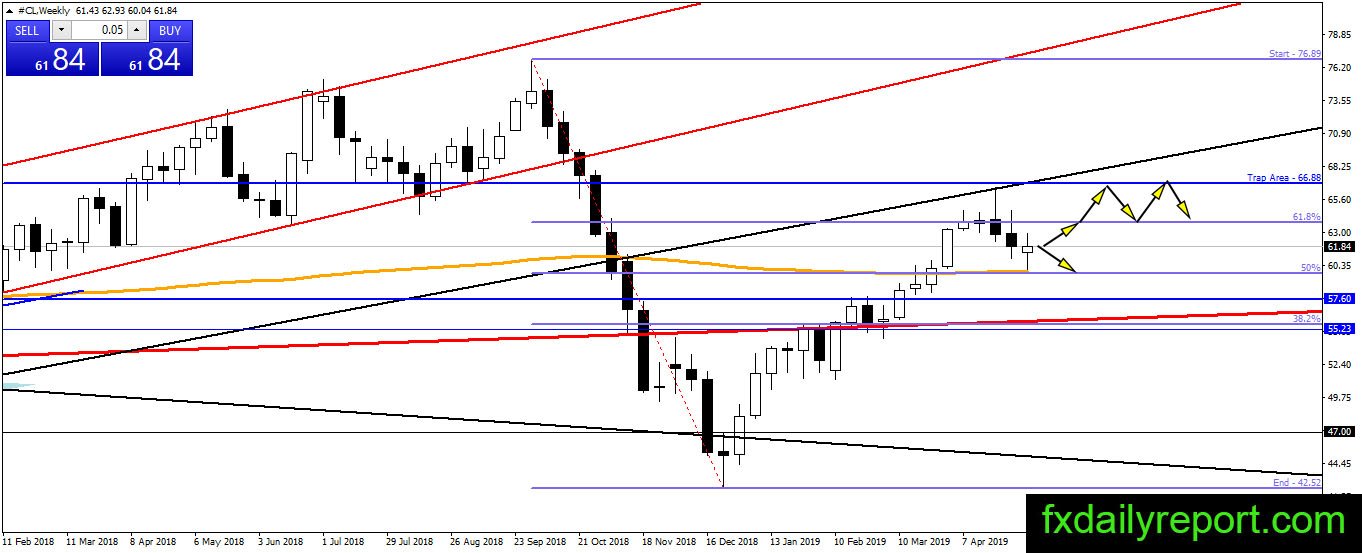
The trendline tested but $66.88 not reached on the weekly chart. The price closed as a bearish engulfing pattern which confirmed in the second week. Crude oil moves lower and tested weekly SMA 200 before bouncing up. Currently, the price might consolidate near the averages before continuing further upside.
A close below the averages will cancel the bullish outlook.
Daily chart

Crude oil on the daily chart is bearish inside the channel, no movement outside of the channel which means traders could plan positions inside the channel. The overall outlook for medium-long-term is bullish which mean long positions favored. Daily SMA 200 is the level to look for long positions.
Trade plan
Bullish trade: Crude oil currently undergoes a bearish correction. Traders could watch the daily, weekly, monthly SMA 200 for possible long positions.
Bearish trade: Short-term positions from the bearish channel on the daily chart is the option trader could take.