
The crypto market is consistently struggling to escape from the overall control of bears while there is still optimism about a likely breakout. The latest statistics point out that prominent crypto tokens like BTC, XRP, FTT, and RSR are still facing pressure while attempting to overcome the bearish momentum while waiting for a bullish market turn.
BTC Price Review
Bitcoin (BTC), the chief crypto token, is currently going through significant sell-offs. The data reveals that the flagship crypto token is currently changing hands at $61,895.27. This figure denotes a 0.11% decline over the recent twenty-four hours. In addition to this, BTC has dipped by nearly 6.05% during the last week.

However, irrespective of the massive sell-offs by the retail investors, as the CVD indicator points out, whales keep accumulating. As a result of this, these big token holders are reportedly reaching their biggest balance levels up till now. The respective activity among the whales mirrors the market confidence. It indicates that the beginning of a bull run could be on the horizon. Additionally, Bitcoin’s RSI stands at 43, displaying that it is slightly oversold rather than extreme. It also hints at a potential bullish recovery in the case of trending toward 50.
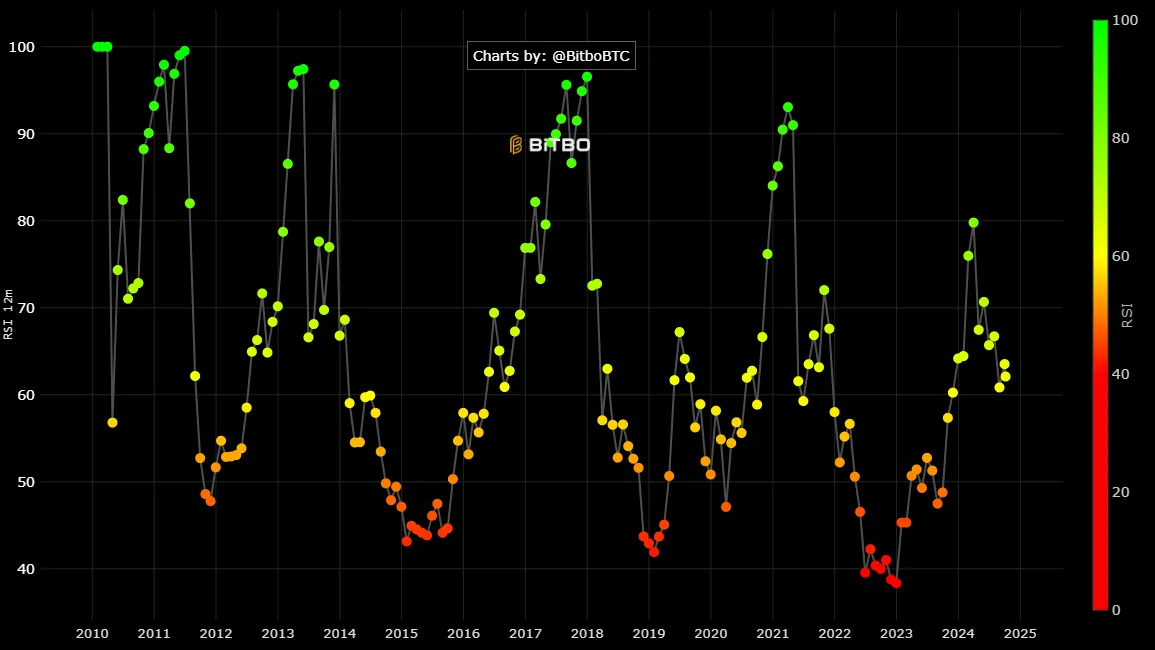
Bitcoin RSI Chart -Bitbo
XRP Price Review
$XRP is presently trading in a sideways pattern as shown in the chart below. The token is reportedly moving between the well-established sell and buy walls, signifying a consolidation period. The crypto token is now changing hands at $0.5292, showing a price dip of 0.41% in the recent 24 hours. Over the last week, it has seen a 13.91% plunge. Moreover, there have been minimal gains along with a deficiency in its price movement. This also suggests that a breakout is looming, with a likely spike in volatility in the upcoming time.
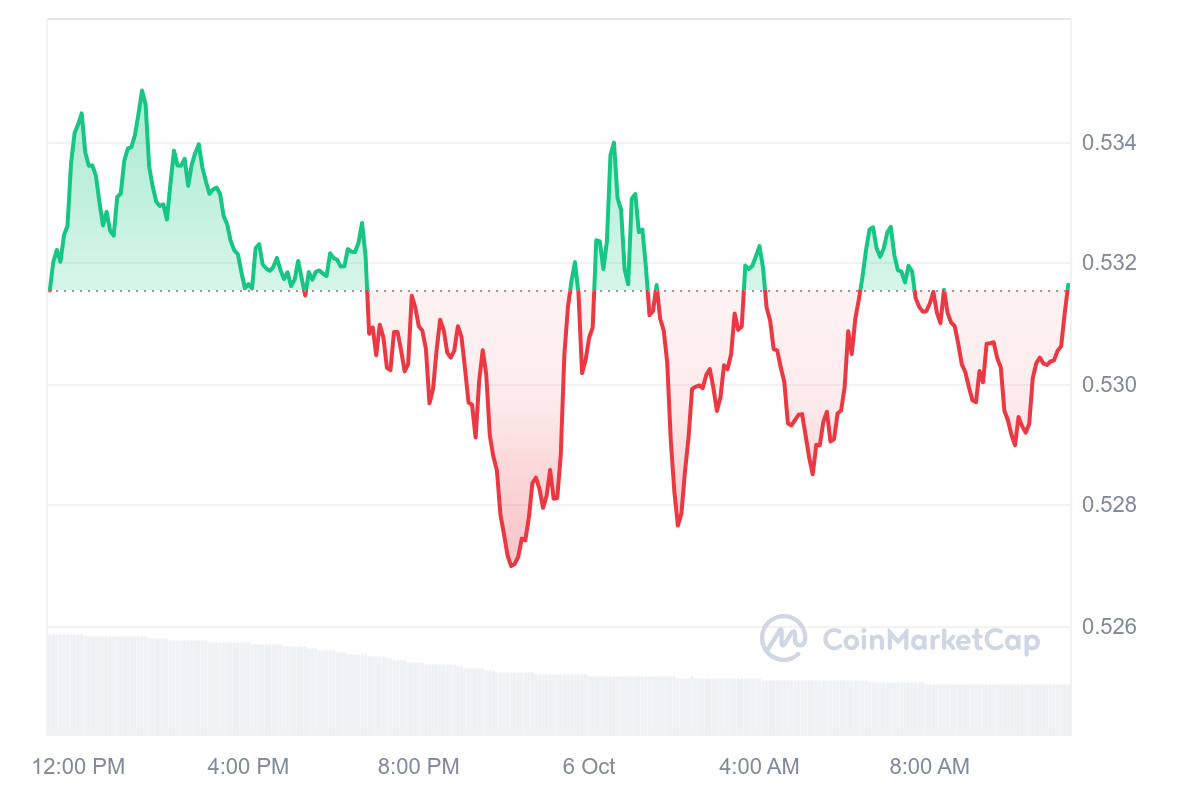
XRP 24-H Chart – CMC
FTT Price Review
$FTT, the native token of the now-defunct crypto exchange FTX, has recently seen significant gains. At present, the crypto token is trading at $2.60 with a 10.42% price rise in the last twenty-four hours. Along with that, it has experienced a staggering 105.10% surge over the recent month. This resilient price movement denotes a positive market sentiment. The RSI indicator stands at a value of 73.8128. Hence, $FTT’s current momentum points toward a resilient market direction.
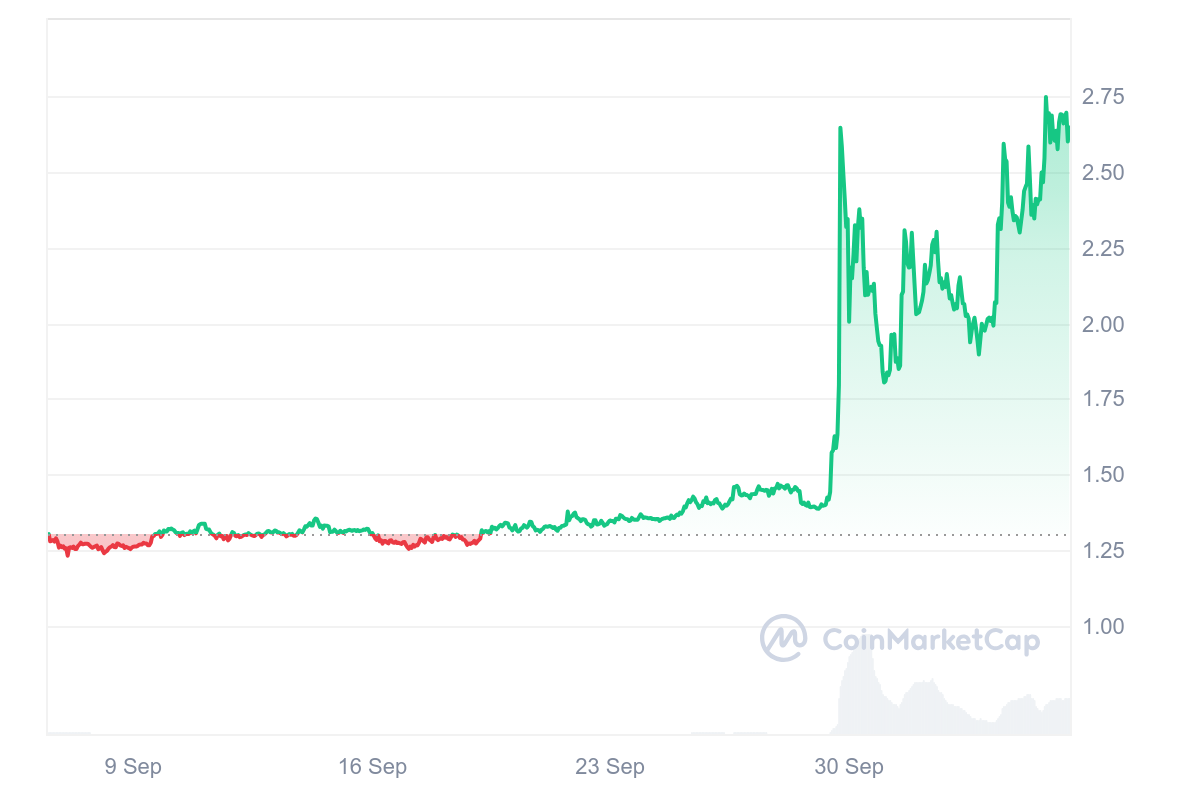
FTT 1 Month Chart – CMC
RSR Price Review
$RSR token is currently experiencing resistance at $0.0066. It has reportedly made a couple of attempts to break through the respective resistance level without any success. While the 3rd challenge to the above-mentioned resistance level is looming, it could denote a pivotal moment in the case of price action. Recently, the CVD indicator signified a huge selling pressure. Nevertheless, now it is showing early indications of buying. This activity points toward a likely momentum shift. Thus, if buying pressure persists and fortifies, $RSR could potentially break through the resistance level of $0.0066, leading to a bullish rally.
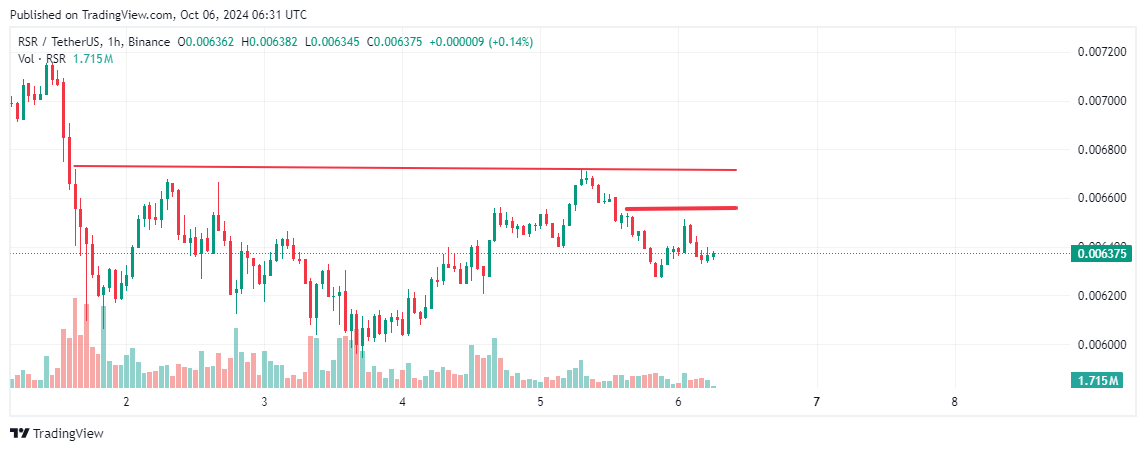
RSR 1H Chart -TradingView