
EURAUD continues to face downside pressure, currently trading around 1.75908 after declining from earlier highs near 1.80000.
The pair appears to be forming an inverted head and shoulders pattern, with the horizontal support around 1.7350-1.7400 acting as a floor while the descending trend line from the April peaks provides dynamic resistance as a neckline.

The moving average configuration presents a bearish outlook, with the 100 SMA (red line) crossing below the 200 SMA (blue line) to form a death cross. This bearish crossover confirms that the path of least resistance remains to the downside, suggesting any rallies could face selling pressure near these dynamic resistance levels around 1.7650-1.7700.
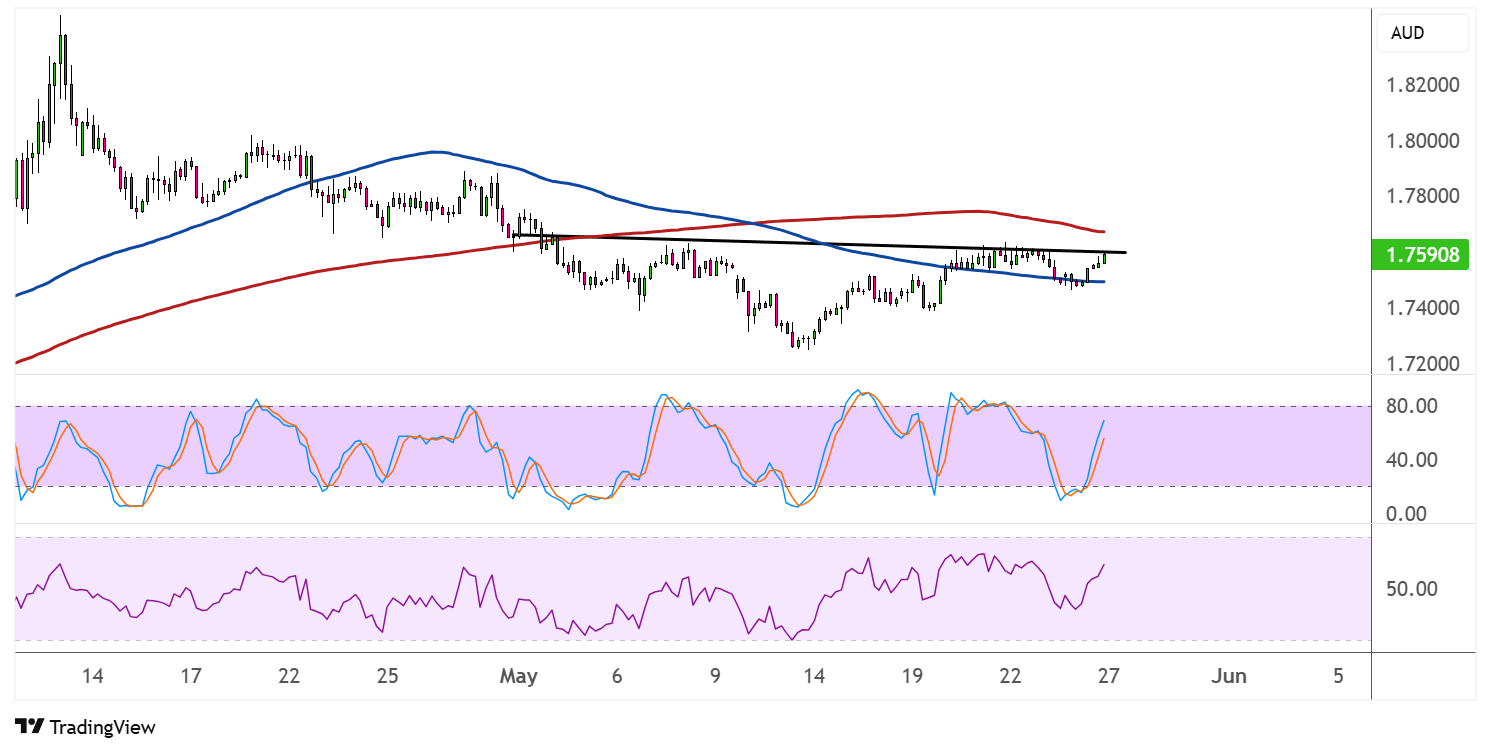
Price action shows EURAUD testing the lower boundary of its recent trading range, with the horizontal support zone representing a make-or-break level for the pair. A decisive break below this support could trigger an acceleration of the downtrend, potentially targeting deeper levels around 1.7200 or lower.
The inverted head and shoulders pattern typically suggests a possible bullish reversal, with the measured move target calculated by subtracting the formation’s height from the breakdown point. Note that the shared currency is riding on some positive sentiment so far this week after US President Trump agreed to delay EU tariffs until July 9.
Technical indicators reflect the underlying bearish momentum. The Stochastic oscillator is hovering in the lower half of its range, suggesting sellers maintain control, though it’s approaching oversold territory where a corrective bounce could materialize. The RSI similarly shows bearish momentum, though it has room to decline further before reaching oversold conditions.
EURAUD could take directional cues from European Central Bank policy divergence with the Reserve Bank of Australia, as interest rate differentials continue to influence cross-currency flows. A break below the triangle support would confirm the bearish bias, while a strong bounce could suggest the formation of a double bottom pattern.