
USDX (USD Index)
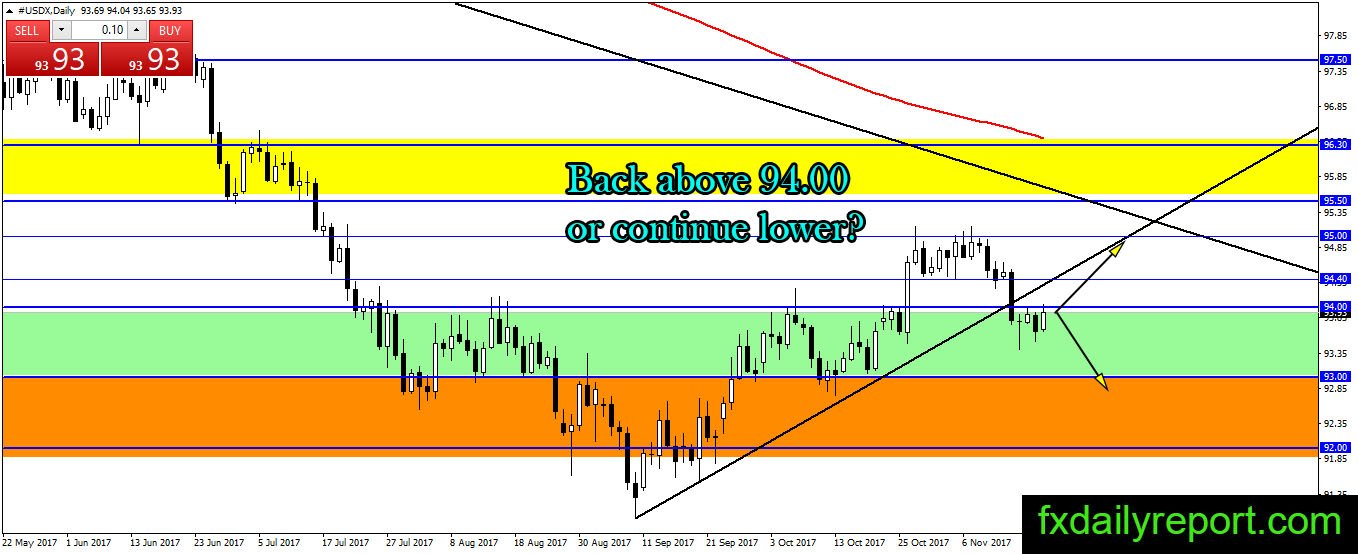
The close below 94.00 in the previous week brought U.S dollar index into neutral-bearish bias. The index is losing grip on the support trend line also the horizontal support. This week, the market started by the bull and the index testing 94.00. Will the index manage to get back above 94.00? Alternatively, will it continue lower to 93.00?
News to watch

09.00 AM & 11.00 AM ECB President Draghi Speaks
07.30 PM Australia Monetary Policy Meeting Minutes
For full outlook for this week, you can follow Forex Outlook For The Week 20 – 24 Nov 2017
Technical Analysis
EUR/USD
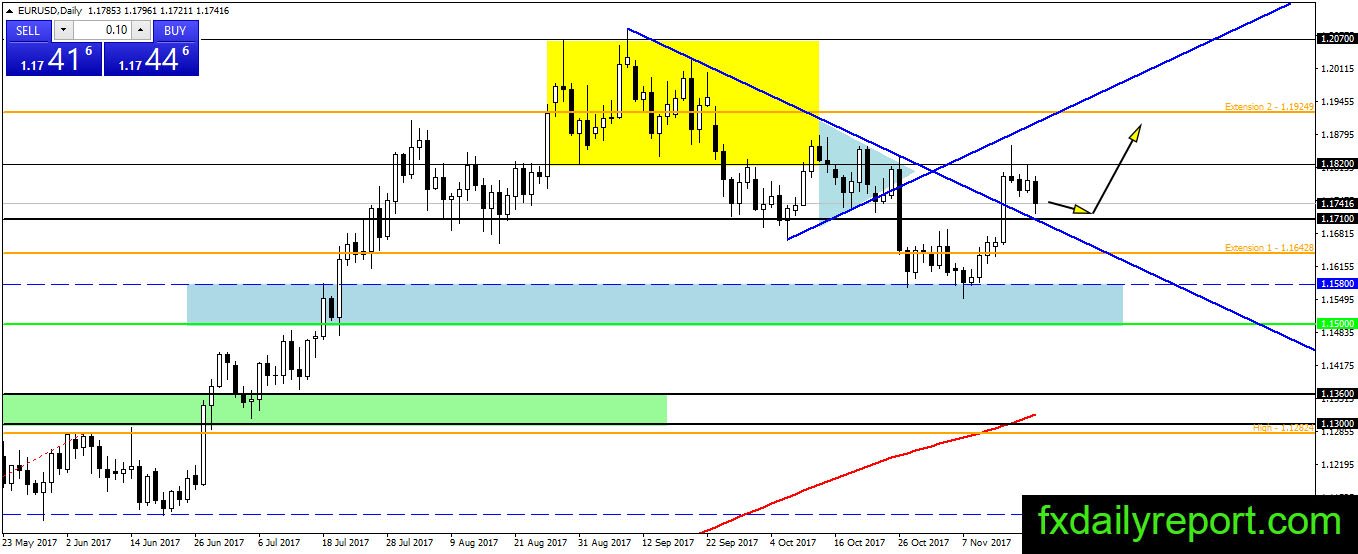
EUR/USD crossed its resistance and made bullish setup. Currently, the pair moves lower, and looks will test 1.1710. Traders could use 1.1710 as support level to place long position. On the other hand, 1.1820 is a good level for short position until it is broken.
Today critical level to watch:
Support: 1.1710, 1.1650, 1.1580, 1.1500
Resistance: 1.1820, 1.1850, 1.1925, 1.2000
GBP/USD
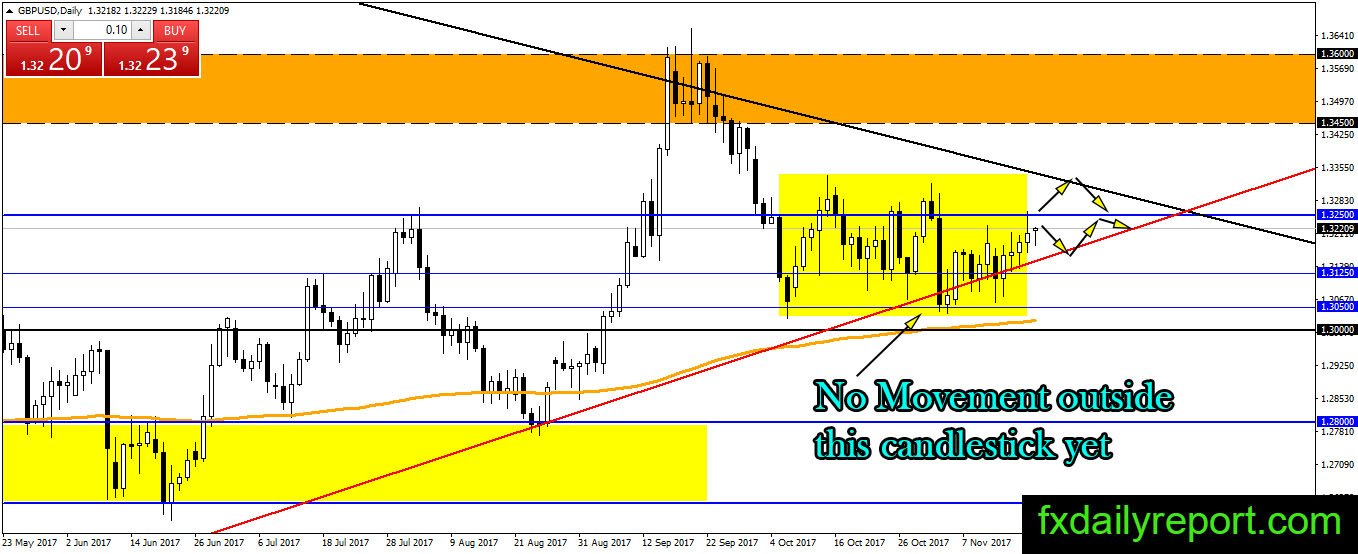
GBP/USD continues higher since the bounce from red trendline. The pair limited below 1.3250, and overall the situation is neutral as price movement inside big bearish candlestick from 1.3250. As long as the candlestick hold, the pair expected to continue movement inside the candle range.
Today critical level to watch:
Support: 1.3200, 1.3125, 1.3100, 1.3000, 1.2800
Resistance: 1.3250, 1.3300, 1.3342
USD/JPY
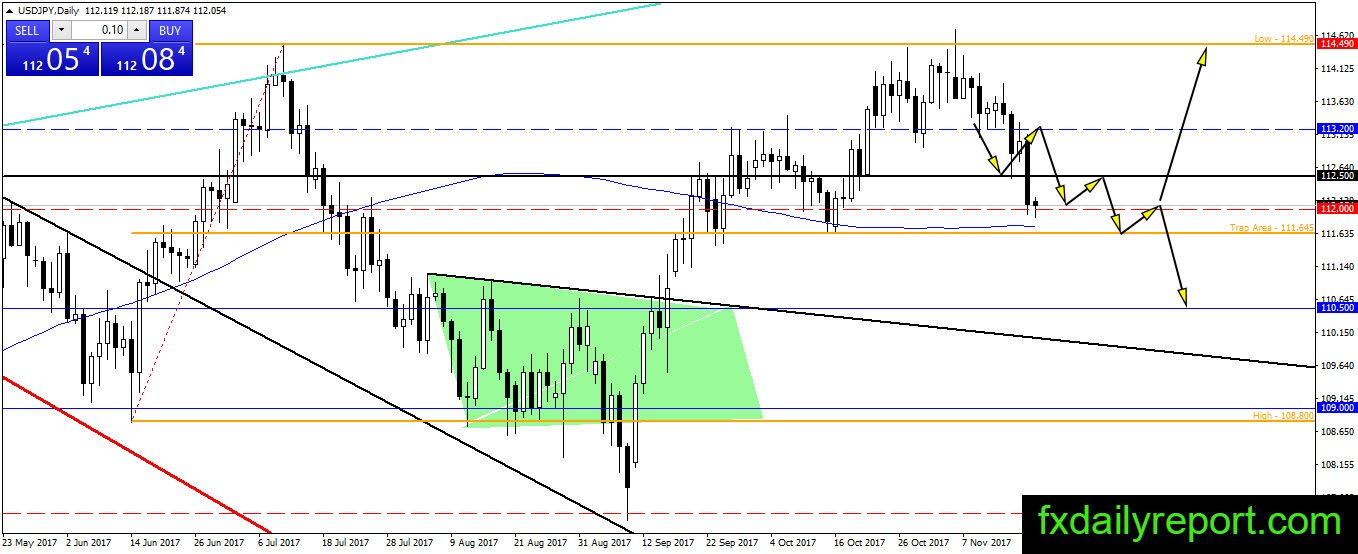
The bear is in control on USD/JPY daily chart. Traders could see the pair descend slowly from one support level to another support level. In the previous week, the pair broke below 113.20 and tested 112.50. Later, the pair made another test on 113.20 before slide lower below 112.50. This week, USD/JPY might test 112.50 before further downside.
Will the bull reverse current situation and lead the pair higher?
Today critical level to watch:
Support: 112.00, 111.60
Resistance: 112.50, 113.20, 114.50, 115.00
AUD/USD
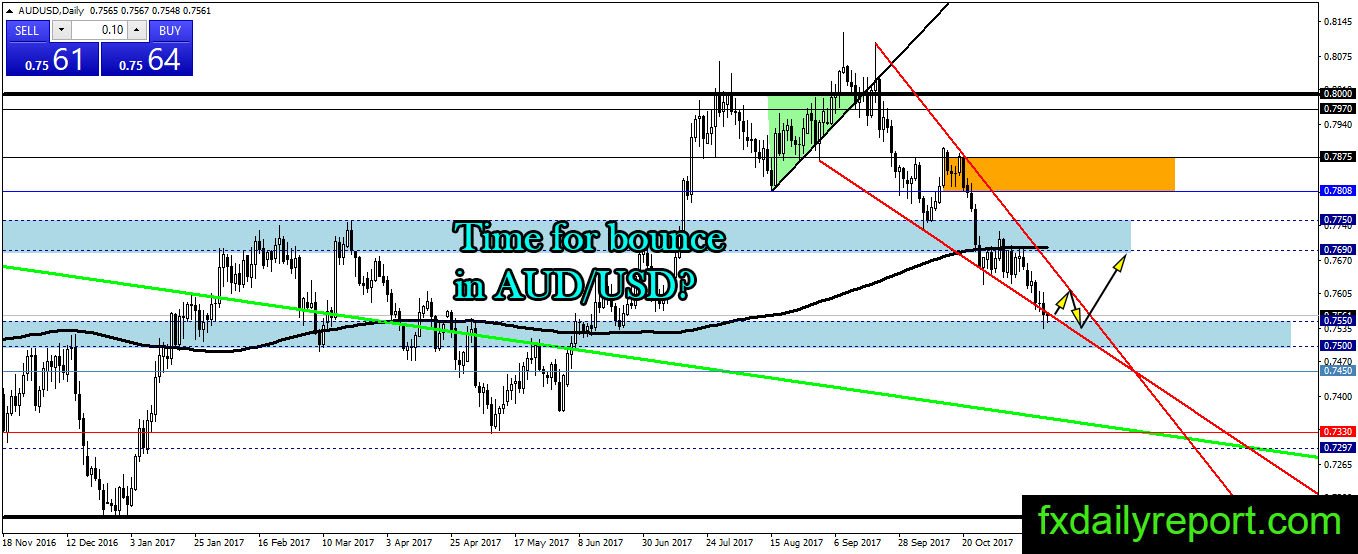
The downward movement of AUD/USD stopped near 0.7500 – 0.7550 support area. The pair shows some indication of bounce following the wick produced after support test. If the bull could maintain the price and build upward momentum, traders might find AUD/USD hanging near daily SMA 200 by the end of week or month.
Today critical level to watch:
Support: 0.7550, 0.7500
Resistance: 0.7690, 0.7750, 0.7800, 0.7875