
Natural gas continues to struggle under the weight of its prevailing downtrend, with price action carving out a descending trend line on the short-term time frame. The commodity is currently trading around $2.648, pinned below both moving averages that are reinforcing overhead resistance.
The 100 SMA is still below the 200 SMA to indicate that the path of least resistance remains to the downside, and both indicators are sloping lower in parallel fashion, reflecting sustained bearish momentum.

Price has been respecting the descending trend line ceiling on each attempted bounce, keeping sellers firmly in control. A break below the channel floor could open the door to a steeper drop toward the $2.600 psychological support area and potentially lower.
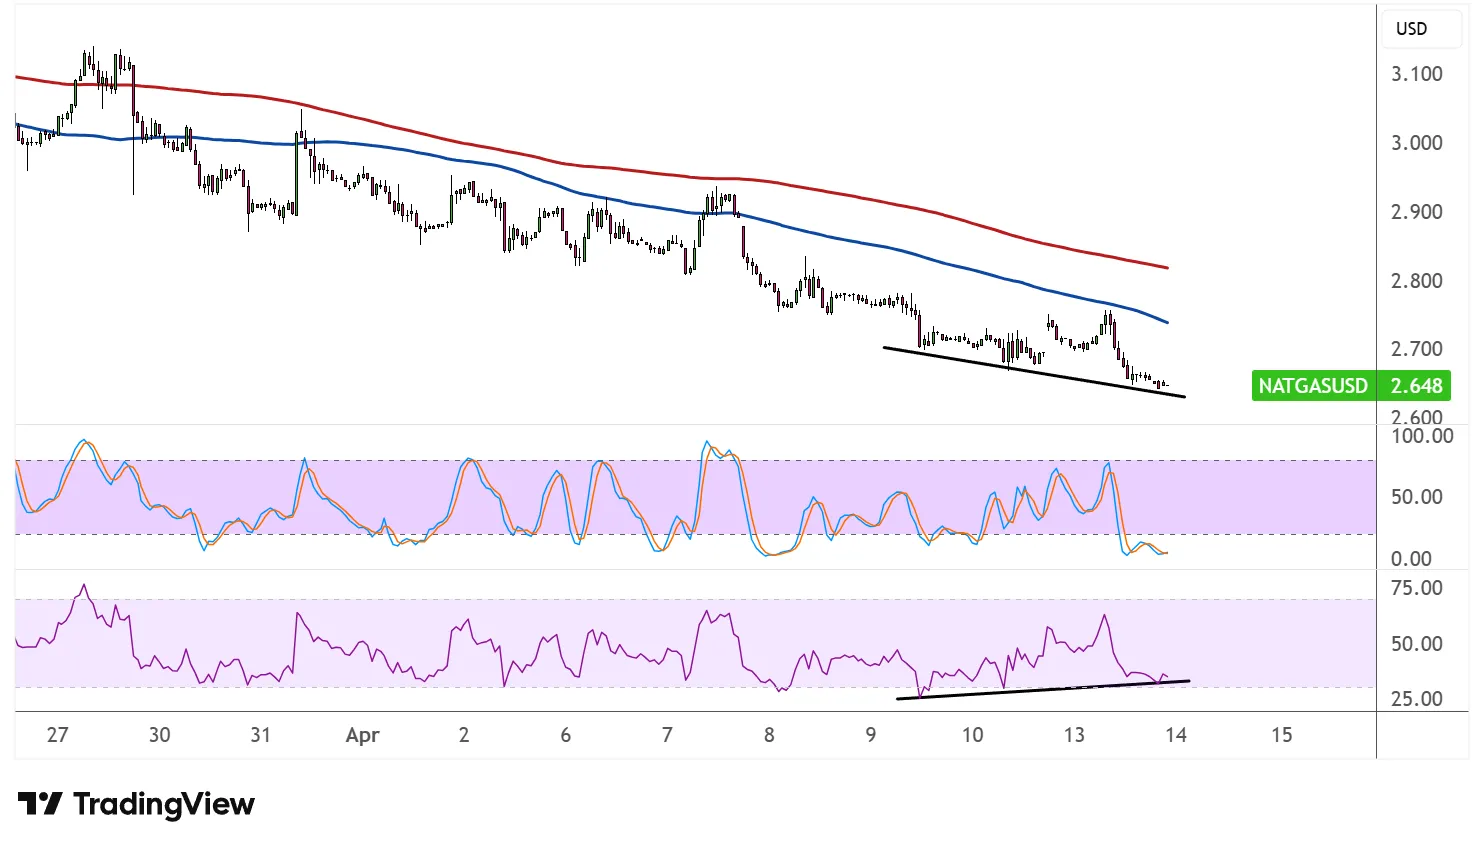
On the subject of oscillators, however, some early warning signals of a potential reversal are starting to emerge. Stochastic has dipped back toward the lower range after a brief uptick, suggesting that bears still have the upper hand for now. The oscillator would need to cross back above its signal line convincingly to confirm a shift in short-term momentum.
More notably, RSI is displaying a bullish divergence against price. The oscillator has been forming higher lows while price has continued to print lower lows within the channel. This classic divergence setup hints that selling pressure may be losing steam beneath the surface, even as price grinds lower.
If RSI follows through and turns higher from its current position near the oversold threshold, natural gas could attract dip buyers looking to fade the downtrend. A confirmed bounce could initially target the channel midline near $2.700, with a stronger recovery potentially eyeing the 100 SMA dynamic resistance closer to $2.760.
A decisive break above the descending trend line, however, would be needed to suggest that a broader trend reversal is genuinely underway. Geopolitical headlines and inventory data could continue to influence natural gas movements, along with weather forecasts that could influence demand.