
Natural gas continues to slide within a well-defined downtrend, with price currently trading around the $2.768 level after bouncing off the swing low at $2.754.
The commodity has been carving out lower highs along a descending trendline, and a corrective pullback appears to be underway that could attract fresh sellers looking to join the prevailing downtrend. The Fibonacci retracement tool drawn from the latest swing high to the swing low highlights where sellers could be lying in wait.

The 38.2% Fib sits at $2.827, which also lines up with the lower boundary of the descending channel and could be enough to cap any recovery attempt. A slightly larger bounce could reach the 50% Fib at $2.849, while a more extended pullback toward the 61.8% level at $2.871 could be the line in the sand for bearish re-entry, as this area converges with both the descending trendline and the 100 SMA dynamic resistance.
If any of these retracement levels hold as a ceiling, natural gas could resume the drop back toward the swing low at $2.754 or extend losses toward the 100% projection near $2.944 in reverse. A break above the 61.8% Fib, however, could put the 100% Fib at $2.944 back in focus as bulls attempt a broader recovery.
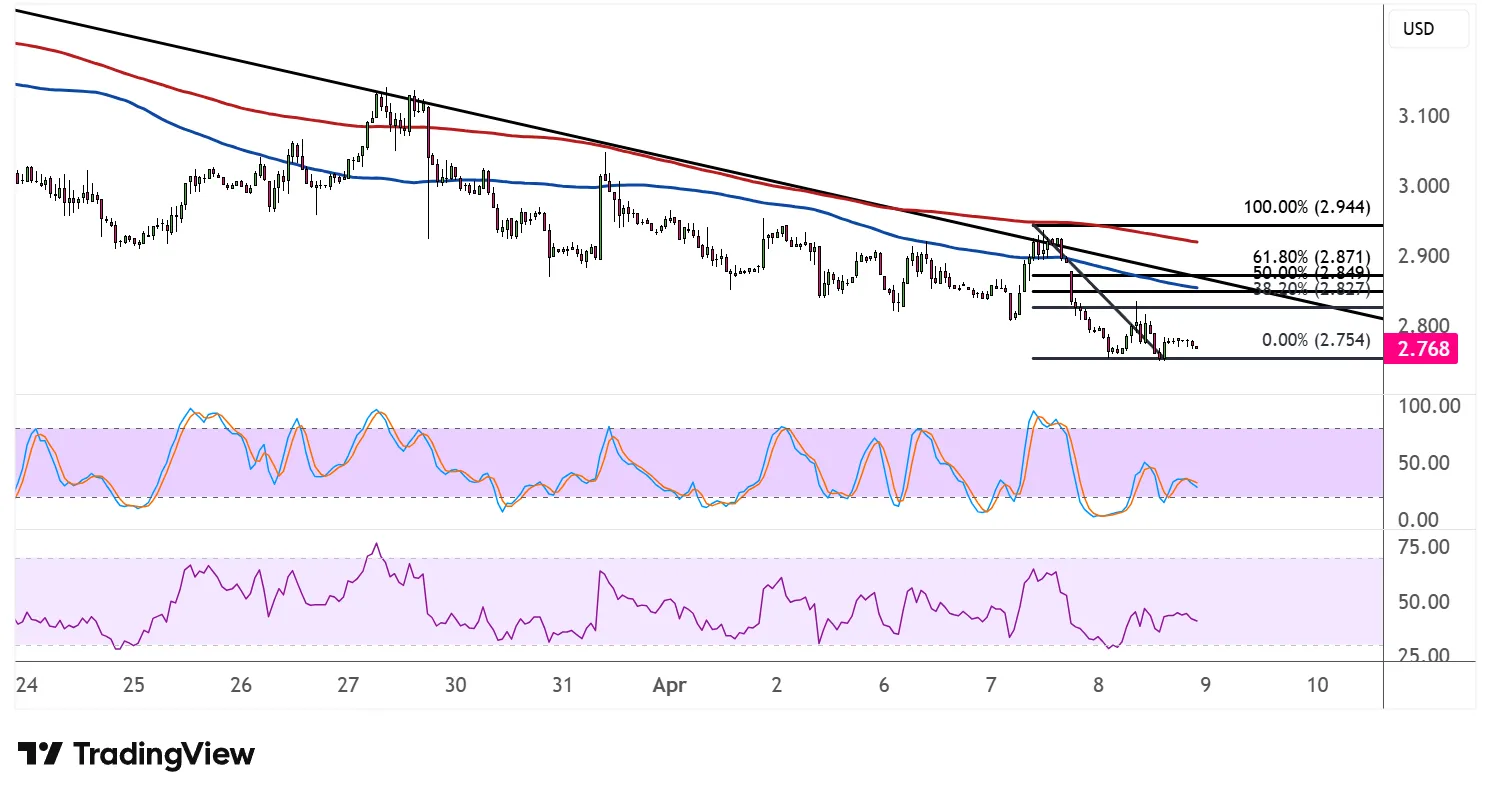
The 100 SMA (blue) is below the 200 SMA (red), confirming that the path of least resistance remains to the downside. Both moving averages are sloping lower and bunching together near the upper Fibonacci levels, reinforcing the overhead resistance cluster.
Stochastic is turning higher from the mid-range area, suggesting some corrective momentum is building. However, the oscillator has plenty of room to climb before reaching overbought territory, meaning the pullback could extend further before sellers reassert control. RSI is similarly pointing upward from the lower half of its range, echoing the possibility of a temporary bounce before the broader downtrend resumes.