
EURCAD has been trending steadily higher within a well-defined ascending channel, but the pair is currently undergoing a pullback after failing to sustain gains above the swing high around 1.6236.
Price is now hovering around 1.6154 as the correction tests key support levels that could determine whether the broader uptrend has enough fuel to resume.

The Fibonacci retracement tool drawn from the latest swing low to swing high highlights where buyers could be waiting to step back in. The 38.2% Fib sits at 1.6167, which is closest to current price and could be enough to attract the first wave of dip buyers.
A deeper pullback could bring price down to the 50% level at 1.6116, while a more extended correction toward the 61.8% Fib at 1.6125 could be the line in the sand for a bullish rebound, as this area also converges with the ascending channel mid-section and prior consolidation structure.
A more significant breakdown could expose the 100% retracement at 1.6056, which aligns with the channel bottom and a stronger area of interest.
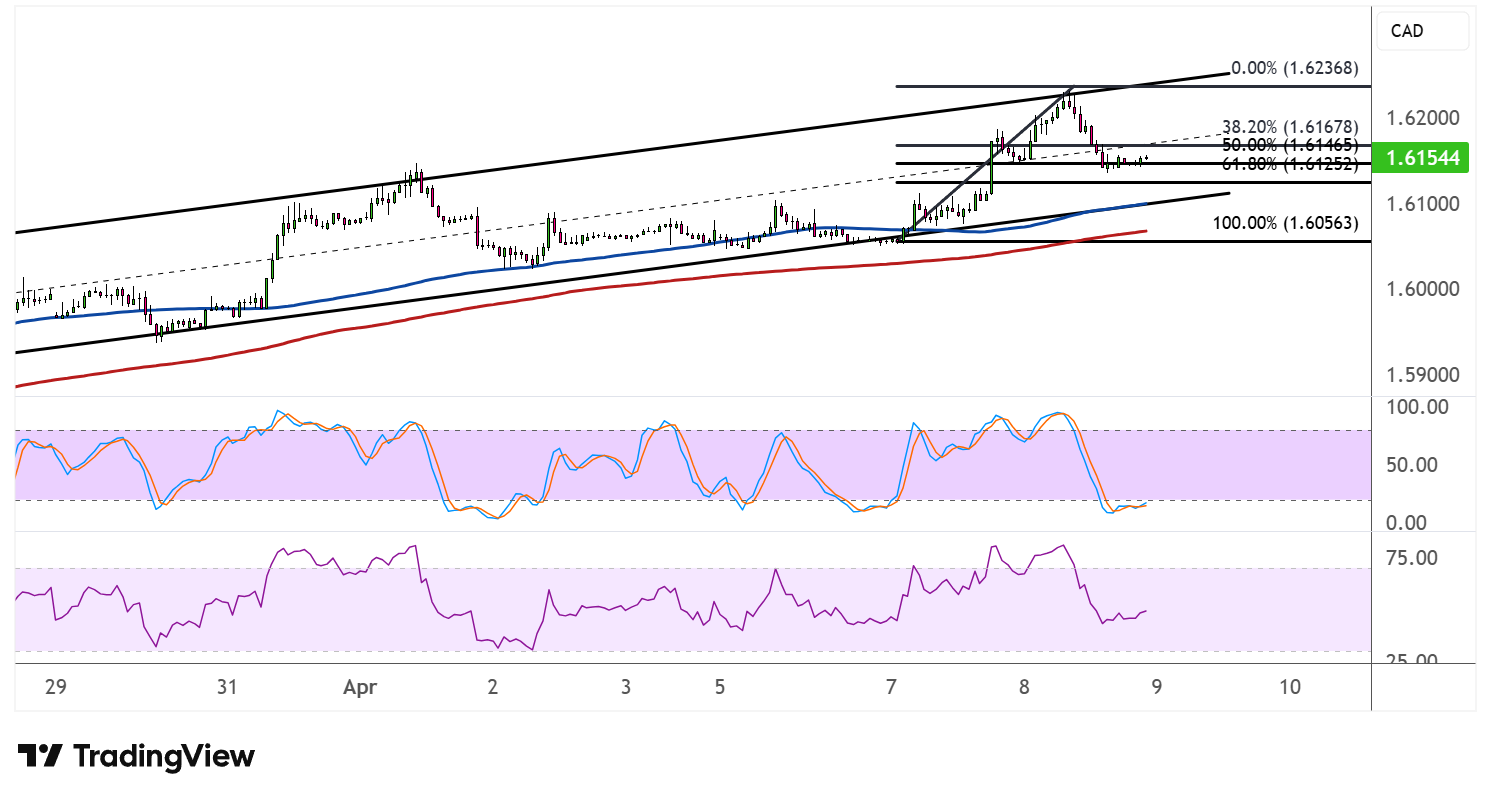
The 100 SMA (blue) is above the 200 SMA (red), confirming that the path of least resistance is to the upside and that the climb is more likely to gain traction than to reverse. Both moving averages are sloping higher and tracking along the lower channel boundary, potentially providing dynamic support on any further dips.
Stochastic has pulled back sharply from the overbought region and is now hovering near the lower end of its range, suggesting that sellers have been active but may be nearing exhaustion. The oscillator could soon turn higher to signal a return of bullish pressure. RSI has similarly retreated from elevated levels and is sliding through the mid-range, though it still has room to fall further before reaching oversold territory.
If any of the Fibonacci levels manage to keep losses in check, EURCAD could resume the climb toward the swing high at 1.6236 and potentially extend the rally toward fresh highs above the channel top.