
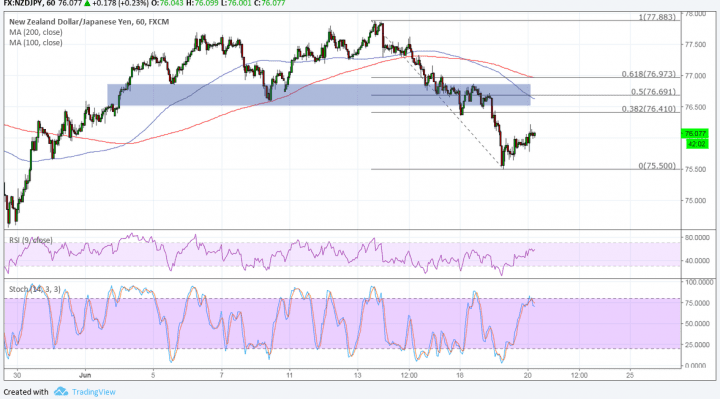
NZD/JPY recently broke below the neckline of its double top formation on the 1-hour chart to confirm that a downtrend is about to happen. However, price found support at the 75.50 minor psychological level and may be due for a correction before heading further south.
Applying the Fibonacci retracement tool on the latest swing high and low shows that the 50% level lines up with the broken support around 76.50 to 77.00. This is also near the 100 SMA dynamic inflection point.

Speaking of moving averages, the 100 SMA is below the longer-term 200 SMA to signal that the path of least resistance is to the downside. In other words, the selloff is more likely to resume than to reverse. The 200 SMA coincides with the 61.8% Fib at the 77.00 major psychological mark as the line in the sand for a pullback.
RSI is still on the move up to show that buyers have the upper hand while sellers are taking a break. This oscillator has a bit of room to climb before hitting overbought levels and reflecting buyer exhaustion, so the correction could go on for a bit.
Stochastic is already turning lower after barely making it to the overbought region, hinting that sellers may be eager to return and push for a drop back to the swing low or lower.
Threats of more tariffs on $200 billion worth of Chinese goods weighed heavily on market sentiment and commodity currencies, lifting the safe-haven yen in the process. Escalating tensions or more retaliatory measures from other trade partners could spur more declines for this pair.
It didn’t help that New Zealand reported a 1.2% drop in dairy prices during the latest auction, following the earlier 1.3% slide. This might be enough to prompt downgrades from Fonterra in milk payout forecasts, which would bring lower profitability and spending down the line.