
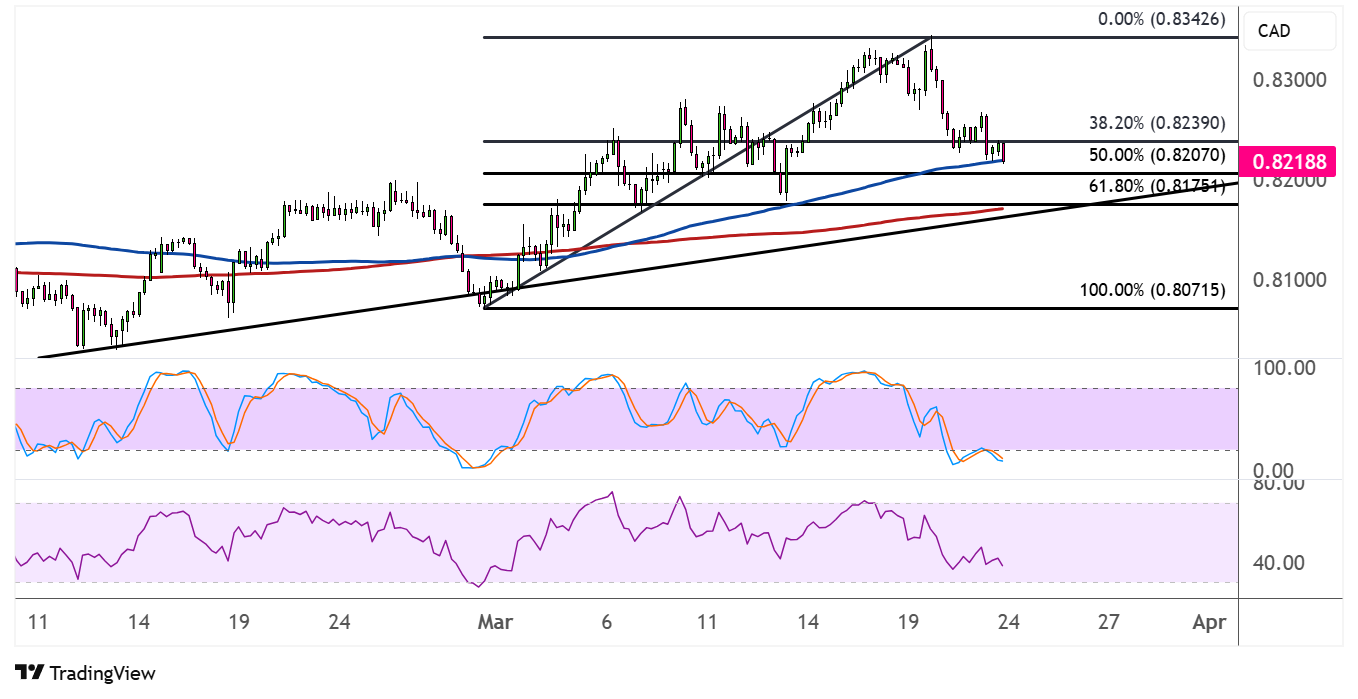
NZDCAD formed higher lows connected by an ascending trend line that’s been holding since mid-February. Price looks ready for a correction to this support area.
The Fibonacci retracement tool shows additional levels where buyers could be waiting. The 50% Fib is near the 100 SMA dynamic inflection point and the .8200 major psychological support which could be enough to keep losses in check.

If that’s the case, NZDCAD could set its sights back on the swing high at .8342 or higher. A larger correction could test the 61.8% Fib closer to the trend line support at .8175 or the 200 SMA dynamic inflection point.
On the subject of moving averages, the 100 SMA is above the 200 SMA to confirm that the path of least resistance is to the upside or that support is more likely to hold than to break. The gap between the technical indicators is also widening to reflect strengthening bullish pressure.
Stochastic is indicating oversold conditions or exhaustion among sellers, so turning higher would mean a return in upside pressure. The oscillator has plenty of room to climb before reaching the overbought zone, so price could keep following suit.
RSI is on the move down to show that bearish pressure is in play, so the correction could keep going until the oscillator reaches the oversold region to reflect exhaustion.
NZDCAD has been on a steady climb, as risk-taking tends to benefit the Kiwi more than the Canadian dollar, which has been subject to oil price declines and tariffs threats from Trump to Canada. Note that the latest New Zealand GDP report revealed an exit from the country’s technical recession, although Canada also reported stronger inflationary pressures.
This suggests that both the RBNZ and BOC could shift away from its dovish stance pretty soon, but it’s also worth noting that the Canadian dollar could be more vulnerable to trade risks from tariffs.