
The strategy to be introduced today is a simple but profitable strategy which requires patience to setup and trade. This is the trendline reversal strategy, which aims to trade a trend line break and reversal against the prior trend, on a long term chart.
Indicators to be Used

Only one indicator will be used to trade this strategy: the trend line tool. The tool is available by default on the MT5 platform. A long term chart is used. In this case, this is the 4hour and daily chart. The essence of using these long term charts is because they offer a better picture of the overall trend of the asset than shorter time frame charts. With this perspective, you can therefore be sure that a trend line break will produce a true reversal and not just a retracement within a trend that has not ended.
The Strategy: How Does This Trade Work?
Successful implementation of this strategy requires two things from the trader:
- Ability to trace a trend line of best fit along the highs or lows of price action.
- Identifying a reversal break of the trend line.
The best way to trace a line of best fit is to ensure that at least three price highs or lows make contact with the trend line. When you use the trend tool, start from a reference low or high and trace it over the price action, ensuring that there is a line of best fit.
The next step is to ensure that there is a true reversal break of the trend line. You can detect this when the following is seen:
- After a period of uptrending prices, a bearish candle forms and closes below the trend line. OR
- After a period of downtrending prices, a bullish candle pushes up and closes above the trend line.
When these conditions occur, the stage is now set for a trade to take place.
Long Trade
Here is how to take the long trade. After a period of downtrending prices, a bullish candle pushes above the trend line which is traced across several price highs (formed during the downtrend) and closes above the trend line.
Wait for the next candle to open and try to head back downwards on the broken trend line. More often than not, this is what the price candle will try to do. At this time, the broken trend line, acting previously as a resistance, will now act in a role reversal, as it will form a new support to resist the downward move of the price action candle. When the candle touches the trend line, the trader should immediately set a LONG TRADE, using the trendline price as the open price.
Alternatively, you can set a BUY LIMIT as soon as the breakout candle closes above the trendline, using the trendline price as the limit entry price.

Long trade setup
Notice how after the breakout candle, the price tried to retreat downwards, but was rejected at the trend line.
Stop Loss
The stop loss for the trade is set at a few pips below the broken trend line. This stop loss should ideally be below the lowest part of the preceding 5 candles.
Take Profit
Aim to take at least 3 pips for every pip risked as stop loss, since the chart is a long term chart which will take some time before the trade ends.
Short Trade
Here is how to take the short trade. After a period of prices trending upwards, a bearish candle pushes below the trend line which is traced across several price low areas (formed during the uptrend) and closes below the trend line.
- Wait for the next candle to open and try to push back downwards on the broken trend line. The broken trend line, acting previously as a support during the uptrend, will now act in a role reversal to form a new resistance. When this 2nd candle touches the trend line, the trader should immediately set a SHORT TRADE, using the trendline price as the open price.
- Alternatively, you can set a SELL LIMIT as soon as the breakout candle closes below the trendline, using the trendline price as the limit entry price.
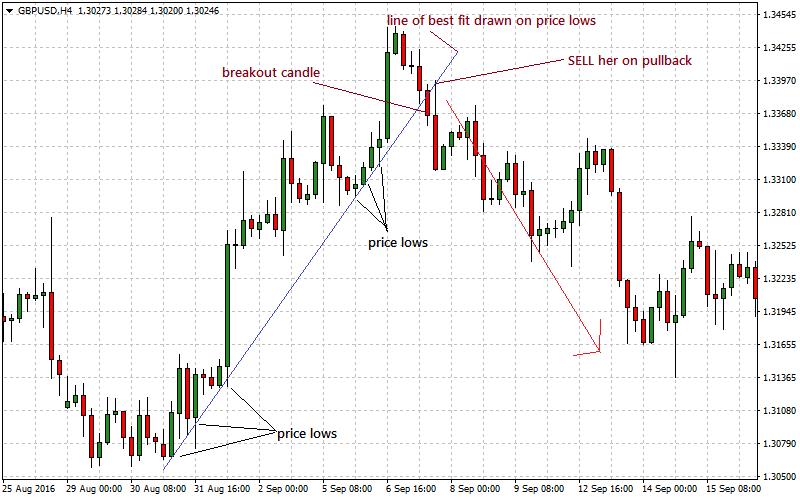
Short Trade Setup
Stop Loss
Set the stop loss for the trade is set at a few pips above the trend line, if possible above the highs of the preceding three candles.
Take Profit
Try to set the take profit to at least three times the number of pips used in setting the stop loss. This will provide a good reward to risk ratio for the trade.
Precautions
Every precaution should be taken to ensuer that only the line of best fit is used to execute this trade. Do not force the line to fit the price candles. Ensure that the trend line tool draw the lines in a natural fit to the candle lows or highs.