
U.S dollar index long-term technical analysis
The coronavirus pandemic has not ended yet. Global market infection and victims continue to rise even though there was an effective vaccine found recently. The world currently under positive sentiment on the economic sector as vaccine distributed across the world. Recovery will happen but it will depend on how the vaccine effectiveness to stop the spread of coronavirus.
U.S dollar index will continue under pressure for the short-medium-term as the government currently pledging full-support to back the economy. Stimulus discussion is in progress, if there is another stimulus announced then traders will expect major weakness in the U.S dollar index.
New Month
Monthly chart
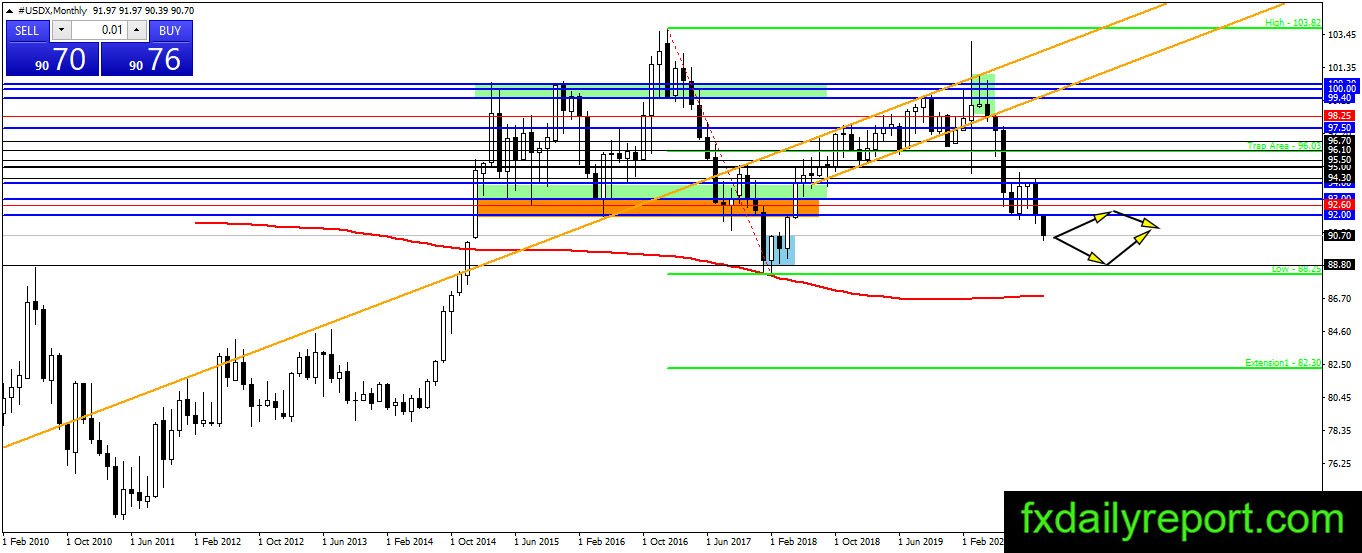

We have a bearish breakout in the U.S dollar index on the monthly chart. The index breakout now could lead it lower to target 2018 low at 88.25. Under the current situation, it is better to avoid taking long positions in the U.S dollar until a bullish reversal happens.
Weekly chart
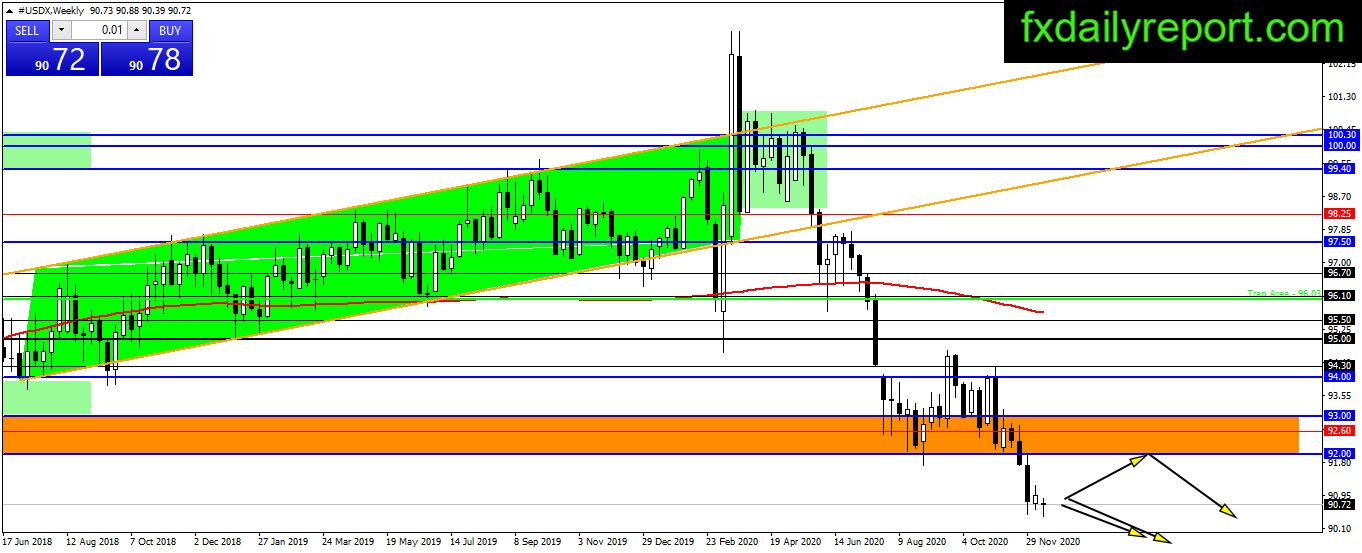
The only direction of the U.S dollar index is lower. The index breakout below the orange area and not looking back again. If a bullish correction happens then traders will expect a test on the orange area. Short positions in the U.S dollar could be taken when there is a major bearish reaction from the orange area.
Daily chart


Similar to the situation on the weekly chart, a bearish breakout has happened. The index previously trading inside a yellow box area and it is currently on the bearish path. The nearest support level to watch is 90.00. Traders might want to hold short positions in the U.S dollar for now.
Trade plan (For U.S dollar pair)
The only plan traders could adopt for now is shorting the U.S dollar whenever there is a bullish correction. U.S dollar index expected to reach 90.00 or the 2018 low at 88.25. If the bearish pressure continues to mount then both support levels may be broken after the test.