
The US Dollar Index appears to be trading in a consolidative bearish channel after a considerable period of bull-run. It looks like the bears are attempting a reversal with the pair pegged between the 100-hour and the 200-hour SMA lines.
The trendline resistance could trigger a major pullback once the consolidation is complete. The currency pair also appears to be closer to completing a double-bottom reversal XABCD pattern formation. That could negate recent ‘consolidative developments.
The US Dollar Index Fundamentals Overview

From a fundamental perspective, the US dollar index is trading at the back of a busy period in the US market. The usual geopolitical tremors involving the US and Iran as well as the trade deal stalemate with China once again dominated the headlines. But there was also some economic data trickling through, which traders would have taken note of.
On Tuesday, the seasonally-adjusted core CPI for last month missed the expectation of 266.119 with 265.921. The non-seasonally adjusted (MoM) equivalent for December also came short of 257.165 with 256.974. As a result, the (MoM) CPI missed the expected change of 0.3 with 0.2 while the CPI ex-food and energy equivalent delivered 0.1% versus 0.2%.
On Wednesday, the PPI ex-food and energy for December missed the (YoY0 change of 1.3% with 1.1%. On Thursday, retail sales ex-autos for December beat the expected (MoM) change of 0.5% with 0.7% while the Philadelphia Fed Manufacturing survey was also positive with a reading of 17 versus an expectation of 3.8.
The US Dollar Index Technical Analysis (the 60-min Chart)
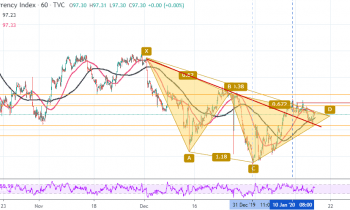
Technically, the US dollar index appears to be trading in a consolidative pattern after recently completing a bearish XABCD reversal pattern formation. The dollar index appears to have run out of momentum following the latest attempt to rebound amid increased bearish pressure.
Therefore, the bears will be targeting short-term profits at around 97.09 or lower at 96.89. On the other hand, the bulls will hope for a significant movement upwards towards 97.46 or higher at 97.67.
The US Dollar Index Technical Analysis (the Daily Chart)
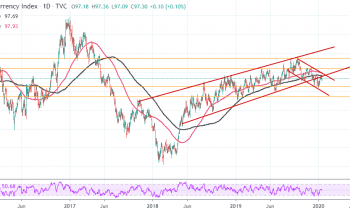
In the daily chart, the US Dollar Index appears to have recently made a bearish breakout off an ascending channel. This indicates an attempt by the bears to take the long-term control of the pair. The pair now appears to be trading within a smaller bearish channel off the main channel below the 100-day and the 200-day SMA lines.
Therefore, the bears will be targeting long-term profits at around 96.53 or lower at 95.40. On the other hand, the bulls will look to pounce for rebound profits at around 98.38 or higher at 99.50.