
The US Dollar Index (DXY) continued with its bull run this week to surge above 97.70 a new 2-week high following the latest US GDP data. The USDX made a bullish breakout off a sharply descending channel earlier this week and has since maintained the trend to re-enter the previous sideways channel.
The dollar index has now ventured into the overbought territory of the RSI indicator in the 60-min chart, which indicates a short-term bullish bias in the market sentiment.
The US Dollar Index Fundamentals Overview

From a fundamental perspective, the US Dollar Index is trading at the back of a busy period in the US market. Besides the renewed hope for a US-China trade deal, the general market has been on an upbeat mood in recent trading sessions with all the major US stock market indices recording gains during the week.
In terms of economic data, the labor market disappointed this week after the initial jobless claims missed the expectation of 225k with 234k for the previous week. Continuing claims also surged above expectations with 1.772M compared to 1.681M projected.
Earlier in the week, the US Markit Services PMI and the PMI Composite beat expectations while the Manufacturing PMI was in line. Housing Starts, Building Permits and Industrial Production also impressed but Existing Home Sales came short.
The Philadelphia Fed Manufacturing Survey was also far from meeting the target of 8.0 after posting a reading of 0.3. However, the annualized Gross Domestic Product for Q3 boosted the USDX after coming in line with expectations at 1.2%.
The US Dollar Index Technical Analysis (the 60-min Chart)
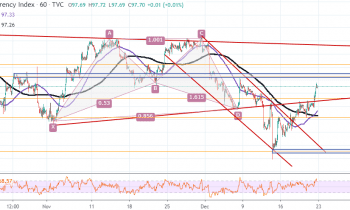
Technically, the US Dollar Index appears to have recently ventured into the overbought levels of the RSI indicator in the 60-min chart. This indicates that the DXY could soon pullback as the bulls begin to take profits.
Therefore, the bears will be targeting short-term profits at around 97.23 or lower at 96.70 going into the weekend. On the other hand, the bulls will look to retain control in the short-term by targeting profits at around 98.05 or higher at 98.40.
The US Dollar Index Technical Analysis (the Daily Chart)
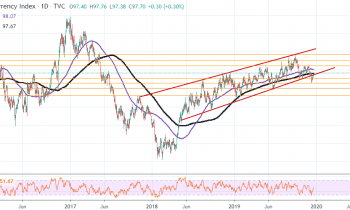
In the daily chart, the US Dollar Index appears to be trading under significant bearish pressure in an ascending wedge amid a recent attempt by the bears to reverse the trend. The USDX bottomed at around 96.60 as the bulls fought back to retain control.
Therefore the bulls will be targeting long-term profits at around 98.46, 99.08 or higher at 99.73. On the other hand, the bears will continue to fight by targeting long-term profits at around 97.09, 96.60, or lower at 96.03.