
On Friday, the US dollar index pulled back from the session highs of about 103.91 to trade at about 103.75. The DXY trades within an ascending channel formation on the 60-minute chart.
The dollar currency index continues to trade slightly above the 100-hour moving average line after making a late rebound. As a result, the USDX still has room left to run before reaching the oversold levels of the 14-hour RSI.
The US Dollar Index Fundamentals Overview

From a fundamental perspective, the US dollar currency index trades during a relatively busy period in the US market. On Friday, the Michigan Consumer Sentiment Index for November rose to 51.5, up from 51 in October, as expected. The Michigan Consumer Expectations Index for the period also spiked to 52.9, up from 50.9, above the forecast of 50.9.
On the other hand, the UoM 5-year consumer inflation expectations for November fell short of the forecast rate of 3.4%, at 3.3%, down from 3.4% in October. The UoM 1-year consumer inflation expectations for the period also fell short of 4.3%, at 3.7%, down from 4.3%.
On Thursday, the Philadelphia Fed Manufacturing Survey for November plummeted to 6.3, down from 20.9, missing the forecast of 20. On the other hand, the initial jobless claims for last week increased to 203k, up from the previous week’s revised figure of 202k, and above the forecast of 197k.
Earlier in the week, US retail sales for October matched the forecasted (MoM) change of 0.2%. On the other hand, retail sales ex-autos fell short of the forecast (MoM) change of 0.1%, with a change of -0.4%.
The US Dollar Index Technical Analysis (the 60-min Chart)
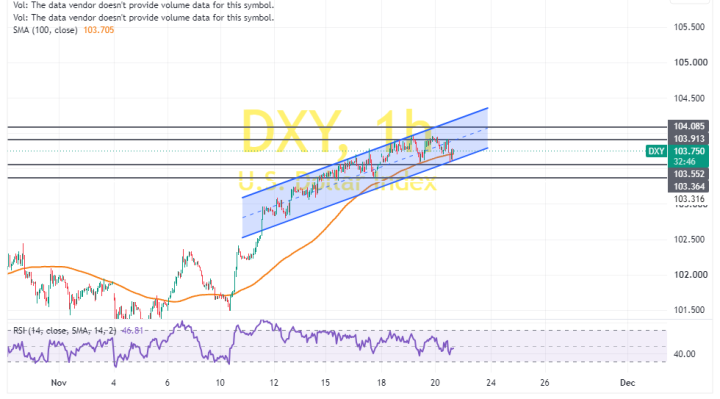
Technically, the US dollar index trades within an ascending channel formation on the 60-minute chart. However, the 14-hour RSI has recently pulled back to move closer to oversold conditions.
Therefore, the bears will look to stretch the latest pullback towards 103.55 or lower, down to 103.36. On the other hand, the bulls will look to pounce on rebounds at about 103.91 or higher, up to 104.08.
The US Dollar Index Technical Analysis (the Daily Chart)

In the daily chart, the US dollar currency index trades within an ascending channel formation. The 14-day RSI also supports a long-term bullish bias as it edged closer to overbought conditions.
Therefore, the bulls will look to ride the current run of gains toward 105.03 or higher, up to 106.36. On the other hand, the bears will look to pounce on pullbacks at about 102.43 or lower, down to 101.07.